Retail giants invest thousands of dollars in big data analytics to understand the relationship between changes in price and demand. Most SMBs don’t have the necessary resources for big data analysis.
But you can still understand and influence the dynamics of the price/demand relationship. Here is what you need to know about the price elasticity of demand and what it means for your business.
What is the price elasticity of demand?
It’s a microeconomic concept that measures how demand for a product is affected by a change in its price.
Price elasticity of demand (ped)= percentage change in demand/percentage change in price.
This value is a negative one in almost all cases since an increase in price is highly unlikely to result in a rise in demand. There are four possible outcomes:
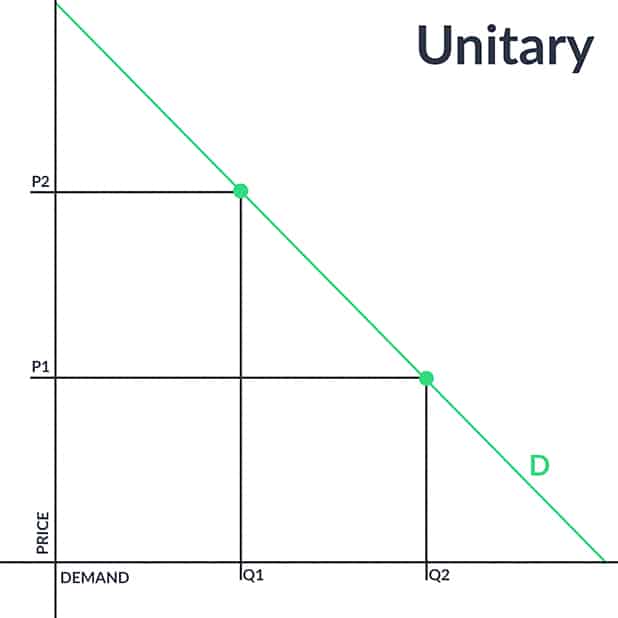
Unit elastic demand
Ped can be equal to 1, where demand will change the same percentage as the price.
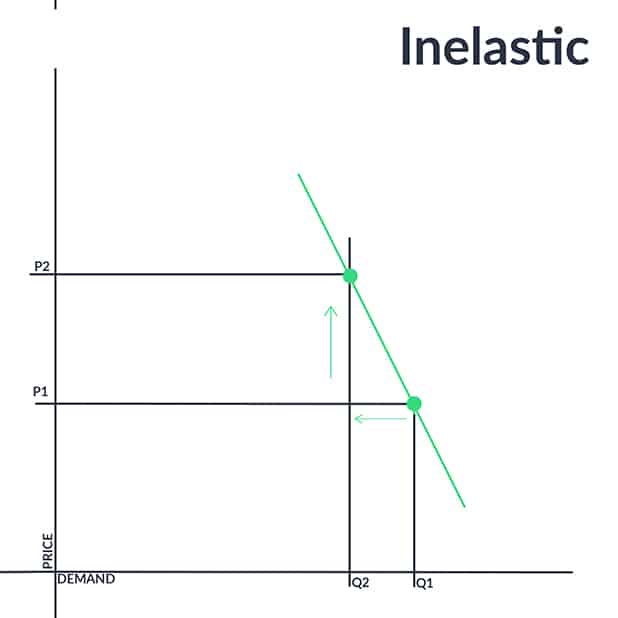
Inelastic demand
Ped can be lower than 1, where the percentage change in demand will be less than the percentage of the price change.
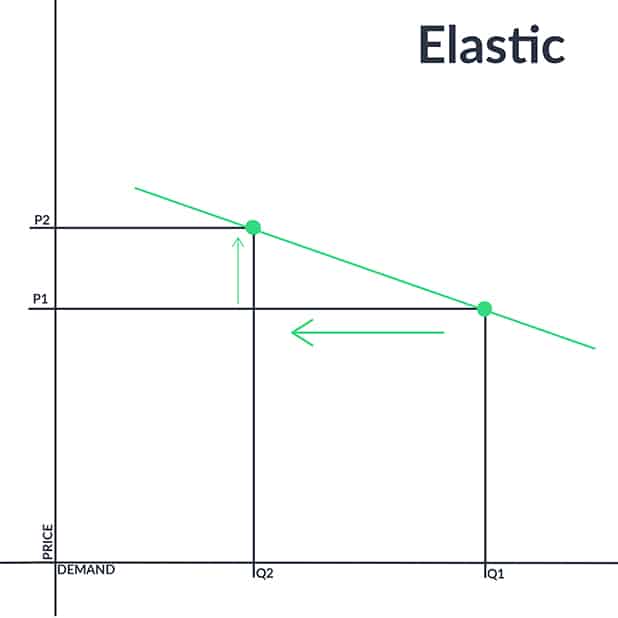
Elastic demand
Ped can also be higher than 1, where the percentage of change in demand is higher than the percentage change in price.
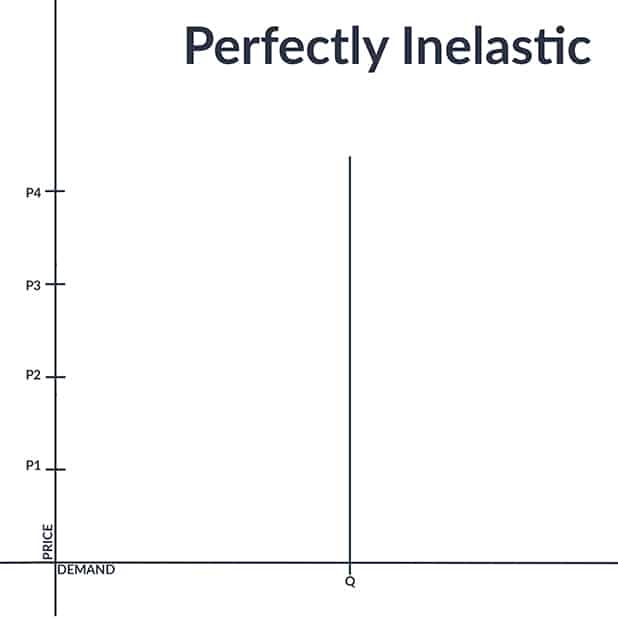
Perfectly inelastic demand
Hypothetically, ped can also be equal to zero. However, it’s not possible in real life. Think of a scenario where a seller increases the price of a product as much as she wants withoexperiencing a decrease in demand. Do you think it’s possible? Not really.
Now that you’re familiar with the concept, let’s look at some real-life cases.
Moderately elastic
Applies to: Smartphones, PC parts, Headphones
People started to shift to Chinese branded smartphones lately. Referring to research conducted by Gartner on worldwide smartphone sales, the company’s senior research director Anshul Gupta stated:
“Demand for entry-level and midprice smartphones remained strong across markets, but demand for high-end smartphones continued to slow in the fourth quarter of 2018”
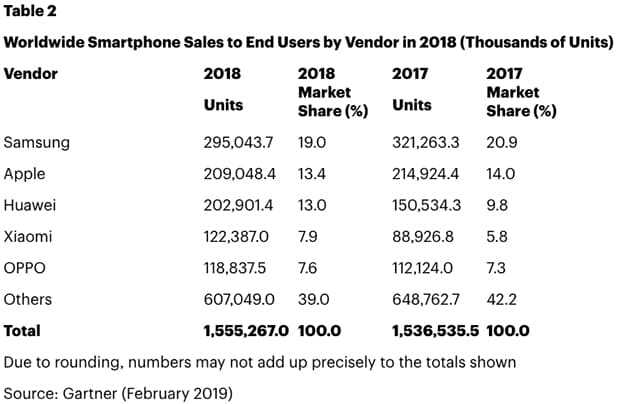
The study reveals that Samsung and Apple both experience declining sales and a drop in their market share. Perhaps these two big players count on branding, a significant contributor to the inelasticity of a product. If customers believe in the uniqueness of a product or think of it as a prestigious item, they tend to buy it regardless of the price changes.
However, there is a limit to it. Branding is only one factor in price elasticity. Huawei, Xiaomi and other mid-priced brands offer affordable options equipped with features very similar to the formerly leading smartphone brands.
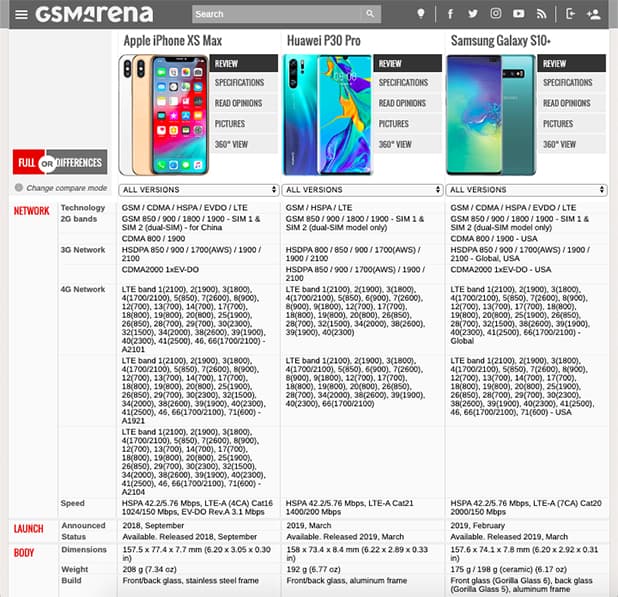
As an online store owner, you can’t control suppliers’ pricing strategy, but you can always provide customers a variety of options. If the price difference between the two brands grows continuously, the product’s price elasticity will increase eventually.
Actionable tip: Adjust your pricing strategy according to the market prices if you see a decrease in demand. Experiment with different pricing adjustments and check your customers’ pulse.
Inelastic
Applies to: Prescription Drugs
According to research, the price elasticity of demand for prescription drugs is about -0.16 in developed countries. Meaning, people don’t significantly react to price changes in prescription drugs.
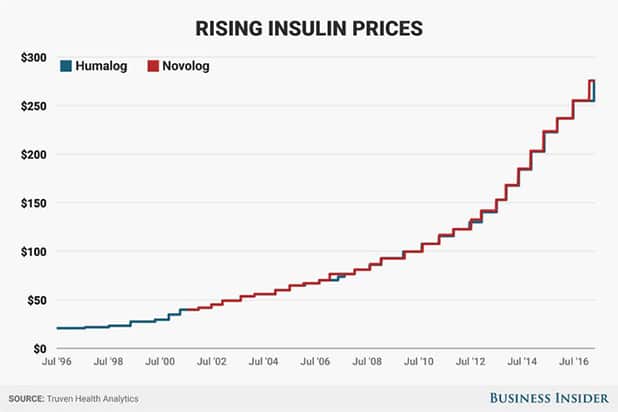
The nature of a product is another factor in price elasticity. Whether it’s a necessary product, a luxury one or neither of the two impacts its price elasticity. Let’s take insulin as an example. I don’t need to remind you how vital is insulin for diabetics.
Unfortunately, insulin prices increased from $35 in 2001 to $275 in 2017. Regardless of the price change, people who need insulin will buy it unless they are unable to afford it.
But that doesn’t mean that necessary goods are inelastic and luxury goods are elastic. In fact, luxury goods are purchased by wealthy customers who are not exactly price-sensitive. Furthermore, the more exclusive a luxury product is, the higher the prestige of owning it, and by extension, the more wealthy customers are willing to pay for it.
Actionable tip: Stick with MSRP or supplier prices because these products are mostly regulated by governments to stay out of trouble.
Highly elastic
Applies to: TVs, Home Appliances, Furniture
90% of online shoppers compare prices before purchasing a product. If someone is buying a TV, she will spend a considerable time on price comparison. Don’t you do so when you’re going to spend a big proportion of your income on a single product?
These types of products are more elastic than FMCG products.
So, when you increase a TV’s price of $200, customers will notice it. Comparison Shopping Engines ease customers’ price tracking process. Remember, even customers that aren’t typically price-sensitive will react negatively to this change.
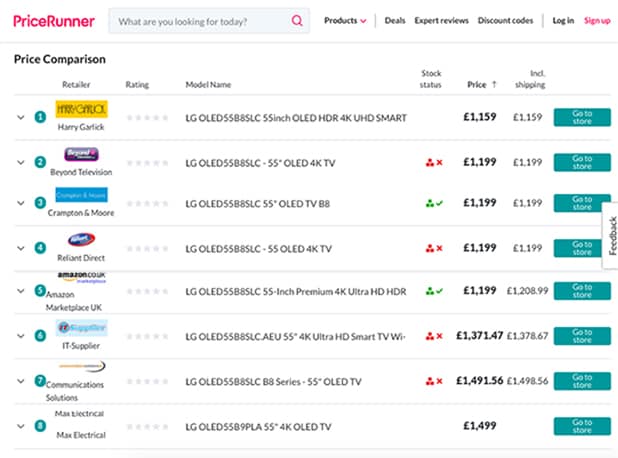
Second, popular products are eventually sold on competitor stores. Increasing prices without taking competitor prices into account can impair your competitive strength and result in a loss of price-sensitive customers.
Actionable tip: Retailers selling highly elastic products need to have a consistent pricing strategy and keep an eye on their competitors.
Real-life examples prove to us how crucial for e-commerce businesses to understand the dynamics of price elasticity of demand. Now, we will learn in detail which factors affect a product’s elasticity.
8 factors affecting price elasticity of demand
1. Is the product necessary or luxury?
Electricity is an essential component of modern life. Just one day without electricity, a big city can turn into a living hell. Regardless of the price increase, people will keep using it. Therefore, electricity, as many other necessary goods, is relatively inelastic.
However, merely the necessity of a product doesn’t tell us much about its elasticity.
Well, the product may be a luxury one, and yet still inelastic. Think of a jewelry brand.

This store can increase the product’s price of $800, but the demand might decrease much less than 10% (note that we lack the information necessary to make an educated guess).
As we’ve talked about above, many people buy luxury products because of their exclusivity. Furthermore, the number of people that buys luxury products is already limited. Thus, a price increase is profitable in this case.
2. Is the product unique or does it have substitute products?
Let’s say you’re going to buy a thermos. There are countless brands in front of you, and you don’t want to spend much on it. You’ll look at product features, and try to find the combination of the best price and best features. During your online research, you came across with this one.
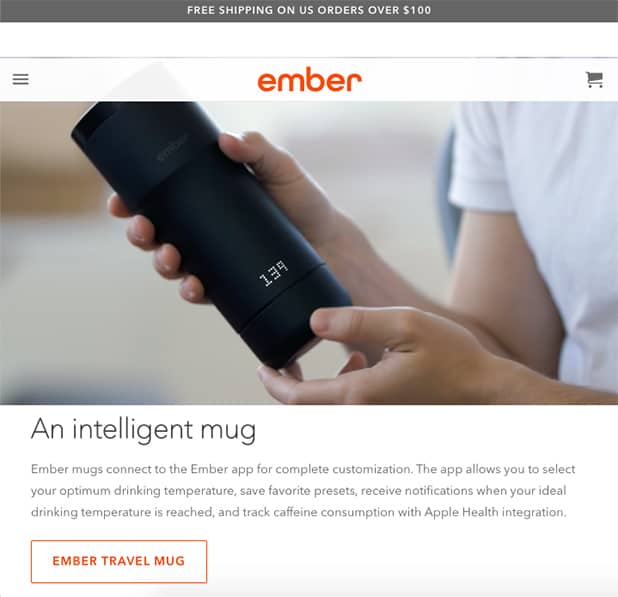
It is a technologically advanced product with an elegant design. The unique qualities of this product charmed you. This particular brand can raise prices without facing a significant decrease in demand. While another brand selling a cheaper mediocre product uses pricing as a weapon, therefore can’t mark up prices.
Let’s say that you came up with a revolutionary product idea and caught the attention of investors. With the money invested, you gradually improved the product, and with each improvement, increased the price. The price of the product is relatively inelastic at this phase.
However, others will catch up. Latecomers will adopt the technology and design of the first market entrant, maybe even surpass it. Every product has a lifecycle like this. The product loses its uniqueness at the end of the cycle.
From that moment on, the product has a higher price elasticity.
3. Advertising & branding
Marketers know how customers’ perceptions of a product may differ (actually, they differ most of the time) from reality.
Popular brands usually gain their popularity through powerful advertising and branding strategies, rather than a significant quality difference. Once they become popular, the price elasticity of demand decreases for their products.

4. Consumer habits
Some people have a specific taste when it comes to alcoholic beverages. For those people, their favorite bottle of beer is relatively inelastic. Unless there is a substantial increase in price, they will keep buying that particular brand.
5. Price/income ratio
As this ratio increases, people become more price-sensitive for that particular product. Especially if the same product is sold on other online stores, customers will try to catch the best price. Meaning, a change in the price will be detected by customers and reflected in demand.
6. Time
When people can’t afford the existing solution of a problem, they manage to come up with a cheaper solution in the long run.
A cliche but a good example is the gas prices. A lot of people drive to work. Suppose there is a sharp increase in gas prices. They have to keep going to work, therefore they can’t react to the price change quickly. But in the long run, people will start moving into nearer places to their work and walk there. Therefore, in the long run, elasticity increases.
7. Urgency
If you’re selling a locksmith service, you have a particular advantage. Customers need your service right away. For products or services that answer an urgent problem, people don’t spend time comparing prices.
Furthermore, one doesn’t need a locksmith service every day and naturally doesn’t know the average market price. Price elasticity is low for that type of products.
8. The situation of the economy
The performance of the local economy has a significant impact on the price elasticity of demand. If the economy performs well, customers tend to spend more.
In the opposite case where people’s purchasing power decrease, they cut their spending and become more price-sensitive. So, in case of an economic downturn, products sold in that market will be more elastic.
Final words
Price elasticity of demand is a measurement of how customers react to price changes, and it must be taken into account when making pricing decisions.
Every product has a different ped, irrelevant of its industry. Calculating it for all of your products is time-consuming and costly, but you can have a general idea by learning which factors affect it. In this post, we’ve listed all the ped determinants for you to come back and check whenever you need to.
Frequently Asked Questions
Price elasticity of demand = percentage change in demand/percentage change in price
It’s a situation where demand will change the same percentage as the price.
There are 5 types of PED. Unit Elastic, Perfectly Elastic, Perfectly Inelastic, Elastic, and Inelastic.


Leave a Reply