Retailers have been battling cart abandonment right from the inception of eCommerce. In the course of time, the old notion of “sell and buy” has transformed into a much-sophisticated system—something that is capable of contributing trillions of dollars to the global economy every year. However, despite the advancements in technology, cart abandonment still remains an unsolved mystery. According to recent studies, online retailers lose $4.6 trillion due to cart abandonment. That’s a lot of potential revenue lost, isn’t it?
As seemingly impossible as it may seem, eCommerce brands can actually recover a significant amount of lost revenue through remarketing and ad retargeting. Having said that, without understanding why customers abandon carts, it is impossible to fight cart abandonment.
Ecommerce Shopping Cart Abandonment Statistics You Cannot Miss
Without data, you’re just another person with an opinion.
W. Edwards Deming
Information is the most potent weapon in an email marketer’s arsenal. Being the most effective marketing medium, the ability of emails to drive unmatching outcomes—depends largely on how much data you feed it.
However, before you dive into your customers’ dataset, it’s imperative to understand their obvious behaviors. This way you will be able to employ the correct analysis and make accurate predictions.
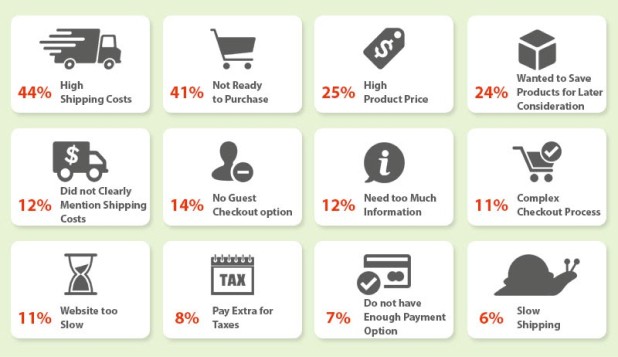
Here are the top reasons that lead to cart abandonment:

Now that you are aware of cart abandonment trends and benchmarks, it’s time to be more specific, and plan strategies to tackle your store’s abandonment issues.
Knowing Your Cart Better
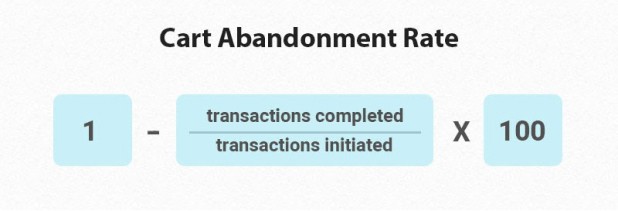
Knowing why your shoppers abandon their cart is the most important thing, but first and foremost you need to calculate your shopping cart abandonment rate.
Your cart abandonment rate is expressed as a ratio. It can be calculated by comparing the number of transactions and the number of shopping carts created.

Having a low cart abandonment rate is the indicator that you’re giving your visitors an awesome shopping experience: It means that they found it easy to navigate your store, the checkout process doesn’t threaten the comfort of online shopping, and you have a secure payment mechanism too.
On the contrary, if your shopping cart abandonment rate is high, it means there is still room for improvement.
6 Shopping Cart Abandonment Pain Points and How to Fix them
Comprehending what provokes your customers to desert their shopping carts can be exhausting. There are dozens of things that could go wrong during checkout, so—if you don’t know where to look at, you might end up frustrated.
Fret not, we’ve gathered the top 8 factors that lead to cart abandonment. We’ll be breaking down each pain point in detail, and provide a quick overview of how you can eliminate cart abandonment and recover sales.
Poor Pricing Strategy
Even though a product is unique, it may be a tougher sell to convince customers to pay a high price. Oddly enough, pricing your products for too low a cost will have a disastrous impact on your bottom line.
There is a field between “too pricey, and cheap”—that’s the sweet spot. The cost of your product must be high enough to convey the value of the product but still low enough to encourage the consumers to buy.
Solution
A customer may initially be interested in a product, but during the checkout, she/he may find that the cost is to be out of their budget due to excessive shipping and handling fees —which can deter her/him from completing the transaction. so, what’s the solution?
Be 100% transparent, and show all costs upfront. Not only that but also break down the shipping cost and provide extra info regarding the total cost.
Besides, incorporating e-commerce pricing software is a great way to fix prices. This will help you listen to your competition, detect patterns, and make adequate pricing decisions that maximize conversions.
Using the Shopping Cart as a Wishlist
Window shopping is one of several things that online shopping has in common with regular shopping. After all, consumers are not so different.
It doesn’t matter whether they are shopping from a brick and mortar establishment or from an online retail store, modern shoppers are more drawn to “window-shop” and browse products than purchase something instantly. The abundance of consumer options stalls their decision-making, which leads to cart abandonment.
Solution
Today, a significant portion of potent retail revenue is trapped in shopping carts. A large share of online shoppers display a certain kind of behavioral trait—leave products in virtual carts for later consideration.
When this is often considered as cart abandonment, this is not a complete loss of opportunity. Through remarketing—by sending an abandoned cart email campaign—retailers can recover at least 5-10% of their almost-lost sales.
Offering exclusive deals or rewards, or telling them the items they’ve saved are about to run out—is a great way to bring back the abandoned shoppers.
There is a big opportunity for websites to reengage users who have added products to their cart but have not completed the purchase with a web push notification redirecting them to their cart page. You can structure your engagement strategy more aggressively, setting automated pushes after 1 hour, 24 hours, and 48 hours with different messages to get users back to the funnel. If users have already converted, they will not receive the next push.
Long and Tedious Checkout Process
Sometimes the best you can do is to not complicate things. A complex checkout can sabotage the entire shopping experience.
The shopper will lose his/her interest and discard the checkout if your intention is to get maximum information. Too many form fields will jeopardize the ease of online shopping and ultimately cause cart abandonment.
Solution
First and foremost—follow a minimalist approach.
Reducing the “number of screens” from initiation to completion is the best way to optimize your checkout process.
Also, having a progress bar on your checkout page and letting the customer know how close they are to finishing the purchase—will inspire them to keep going.
Amazon’s checkout flow is the ideal example of this:

Using pre-fill form fields is a good idea too. This will make things a bit easier than it actually is.
Forceful Account Creation
If you look closely, both traditional and online shopping serves the same purpose.
What makes the online version of this “sell and buy” notion is convenience and ease of buying. When you add an extra step in the checkout process—asking your shoppers to create an account—there is a possibility that it might hinder users’ overall experience.
According to Baymard research, 28% of shoppers leave the checkout process unfinished because the site wanted them to create an account.
Even if most of the retailers offer some flexible registration options via Facebook and Google accounts, it isn’t just enough to compensate for the gap in user experience. Of course, data is important, but the question is whether these data are worth enough to sacrifice a potential deal?
Solution
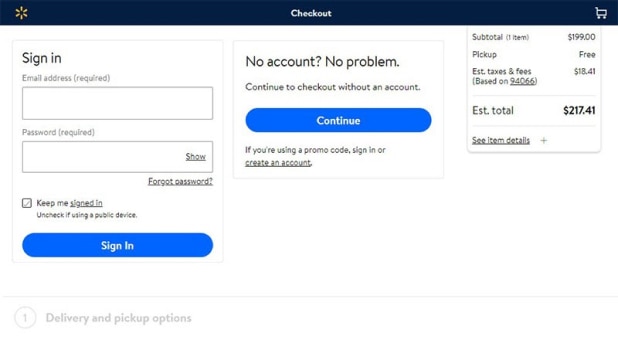
Offering a guest checkout is the most popular method used by retailers to make their checkout flow easy and seamless. It’s not only new users who exit their cart due to the lack of guest checkout but also, a substantial number of registered users abandon the checkout because they’ve forgotten their credentials.
This is how Walmart’s checkout process looks like:

Concerns Regarding Payment Security
To buy something from your store is the highest degree of commitment you can ask from your shoppers.
When you do that, you must support your intention by offering everything that a customer values. You must have flawless navigation, uncompromised product quality, most importantly, you should establish trustworthiness.
Money being the most important aspect of any eCommerce transaction, payment security demands utmost attention. In fact, a study published by 99firms shows that 17% of online shoppers desert their cart due to security concerns.
There are various suspicious factors that sprout payment security concerns inside a shopper’s brain: design flaws, outdated layouts, missing images, lack of SSL certificate, etc.
Solution
Firstly, get an SSL certificate. If you haven’t received it while purchasing the domain, you can get it from ssl.com.
Be transparent. Make sure you have provided sufficient information—phone number, address, and social media handles.
Social proof will help build trust. Incorporate customer testimonials and product reviews into your website and social channels to improve credibility.
Too Many Upsells and Cross-sells
Up-selling and cross-selling are the two most effective sales acquisition strategies every eCommerce retailer loves to try their hands at.
Since Amazon—the world’s most relentless retailer—has managed to achieve massive success through its upselling, every small and medium eCommerce brand has begun to employ the same strategy too. But, it’s not a secret that, like everything else, if done to excess, upselling can hurt the user experience.
Solution
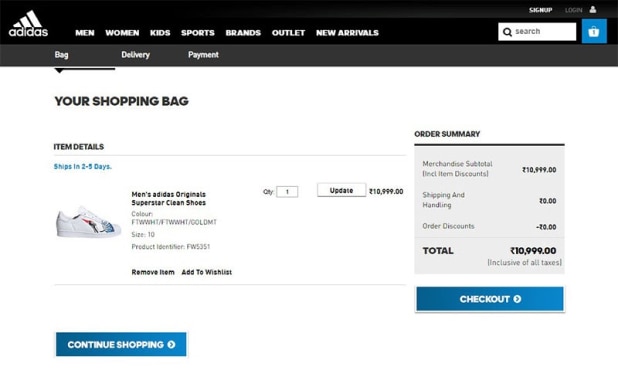
Instead of aggressive upselling, Adidas decided to go with a clean checkout strategy without any distractions. This type of approach helps users to stay focused on the current purchase, and also, ensures a smooth and undisturbed checkout experience.

Hiding your navigation menu is another commonly used method.
Conclusion
Knowledge without action is meaningless.
Now that you are aware of the reasons that drive cart abandonment, it’s time to act on it. Anyhow, before you decide on strategies to recapture your lost shoppers, we suggest performing a thorough assessment of how your online store currently addresses these issues.
While remarketing and retargeting are great ways to minimize your cart abandonment rate, without knowing where you stand in terms of addressing the pain points, it’s impossible to figure out the ideal cart recovery approach that suits you best.
cart abandonment


Great post.. Very deeply you have wrote about cart abandonment. Thanks for sharing such an informative an valuable content..
Thank you for the wonderful comment! We're glad to be helpful.
Thanks for sharing this wonderful article. It’s a really helpful article about this. I would like to share this article on my
social channels. It’s really great one.
Thank you. Glad to hear we could be helpful and we really appreciate the share!
Of course, it is so significant to be able to save the quantity of your sales and increase it afterwards. But it is really sad when sellers face such a destructive thing like a cart abandonment, affecting their business in a negative way. Without any doubts, It is so important to build a proper plan to boost the conversions on your products and increase their sales. I think that one of the most effective ways to do it is to generate more product reviews because reviews frequently make customers trust you and the quality of your items play a key role in the sales. I think that any seller needs to pay attention to it because positive reviews can contribute to the reception of profit eventually.
// Marina Teramond
This is a very good article Knowing why your shoppers abandon their cart is the most important thing, but first and foremost you need to calculate your shopping cart abandonment rate.. keep it up.