Four Things That Make Coralogix Unique
SaaS Observability is a busy, competitive marketplace. Alas, it is also a very homogeneous industry. Vendors implement the features that have worked well for their competition,…
Whether you are just starting your observability journey or already are an expert, our courses will help advance your knowledge and practical skills.
Expert insight, best practices and information on everything related to Observability issues, trends and solutions.
Explore our guides on a broad range of observability related topics.

Observe is a SaaS based observability tool built on Snowflake. It offers a graph-style approach to observability data, claiming that this makes it easier to correlate data in a seamless fashion. However, Observe’s pricing and data access is complicated with terms and concepts such as data “freshness” and “acceleration” which without reading the super fine print, could leave you either with limited access to your data, exorbitant bills or both. Furthermore, much of their basic functionality, from tracing to log querying is very immature, without any correlations to other data types, no UI customization, etc.
Let’s dive into how Observe compares to Coralogix.
| Feature | Coralogix | Observe |
|---|---|---|
| Logs, Metrics & Traces | ✅ | ✅ |
| Alerting | ✅ | ✅ |
| RUM | ✅ | ❌ |
| APM | ✅ | ❌ |
| Machine Learning Capabilities | ✅ | ❌ |
| Pricing Model | ✅ Data ingested per data pipeline (see more details below) | ❓ Data ingested plus additional costs for querying and “refreshing” data |
| Ingestion Costs | Logs: $0.17 – $1.50 per GB Metrics: $0.05 per GB Traces: $0.15 – $0.75 per GB | Logs: $0.68 – $0.46 per GiB Traces: $0.71 – $0.50 per GiB Metrics: $0.008 – $0.00545 per DPM |
| Built-in Cost Optimization | ✅ | ❌ |
| SIEM & CSPM | ✅ | ❌ (CSPM via AWS Security Hub) |
| Remote Archiving | ✅ | ❌ |
| Rapid Archive Query | ✅ | ❌ |
| Schema on Read & Schema on Write | ✅ | ❌ |
| Support | ✅ All customers get 24/7 support, with 15-second median response times | ❓ Unknown |
| Kubernetes Dashboards | ✅ | ❌ |
| Serverless Dashboards | ✅ | ❌ |
| Compliance Certifications | ✅ SOC 2 Type 2, PCI-DSS, HIPAA, ISO/IEC 27001, ISO 27701, GDPR, FedRAMP Moderate | ❌ SOC 2 Type 2 |
| Federated Teams and Permission Management | ✅ Teams can be part of a single organization. Permissions can be managed at the organization or the team level, including organization-level admins. | ❌ Teams are entirely independent, and all permissions are managed internally. |
Both Coralogix and Observe offer support for logs, metrics, and traces. Both also directly integrate with open-source tooling like OpenTelemetry, Fluentd, and more. However, even for basic functionality such as querying, alerting, dashboarding, customizing UI and more, Observe lacks maturity and certainly doesn’t have any of the advanced features that Coralogix offers, such as Flow Alerts.
Coralogix alerting has unique features like Coralogix Flow Alerts, which allow users to orchestrate their logs, metrics, traces, and security data into a single alert that tracks multiple events over time. Using Flow Alerts, customers can track the change in their system.
Observe argues that its dataset and graph-based approach enables better correlation of data. While this does open some powerful doors, based on their documentation and video demos, there are some aspects where data isn’t as readily available.
For example, only logs can be viewed for the relevant containers when viewing traces. In Coralogix, logs, metrics, traces, alerts, and new feature releases are available in a single, flexible view.
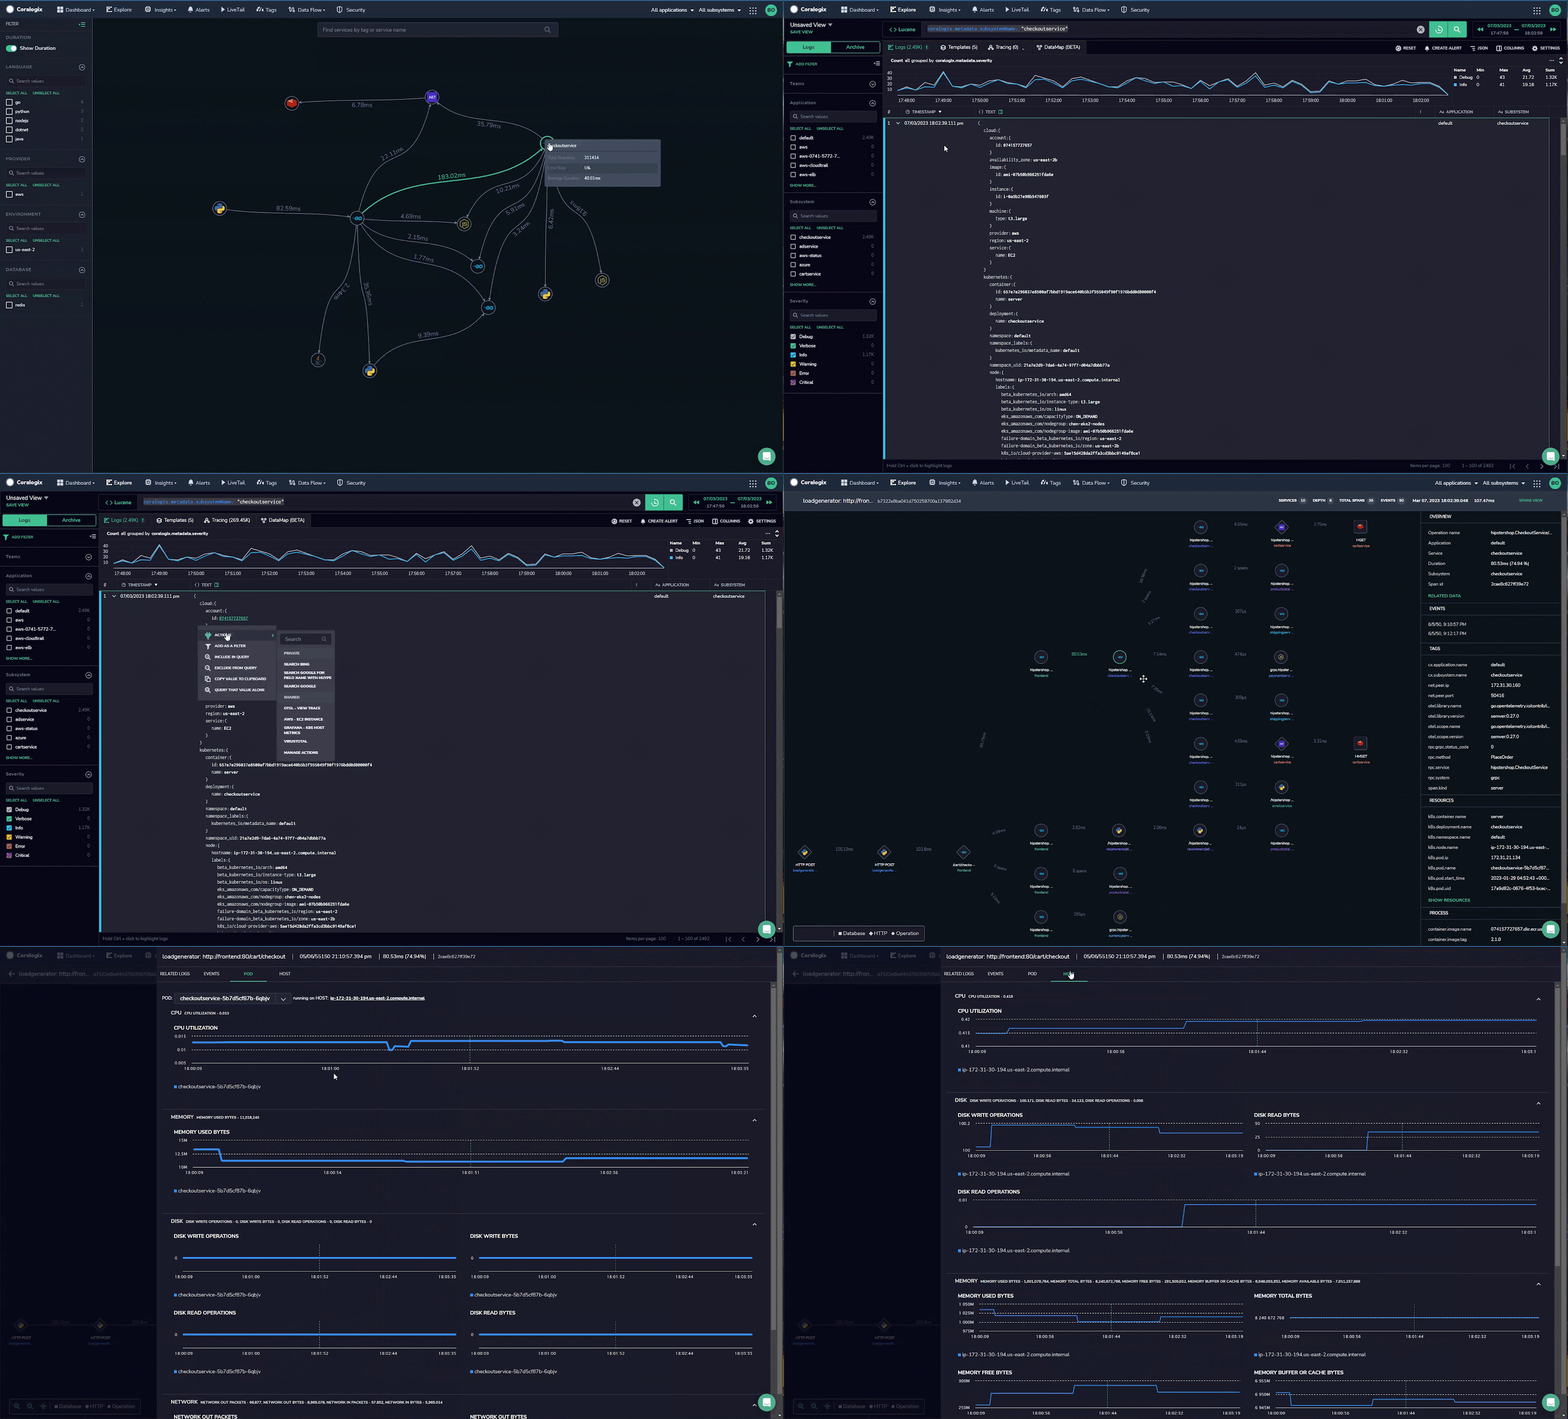
Observe does not offer any anomaly detection features. This makes it difficult for Observe customers to tackle the “unknown unknowns” and instead rely heavily on traditional alerting to capture those dangerous edge cases.
Coralogix Loggregation is another unique feature in the Coralogix toolkit. Loggregation will automatically cluster similar logs together to form a “template.” This functionality allows users to understand which logs are noisiest and account for the most errors and more.
Observe does not appear to offer an archiving solution. Instead, it relies on “Acceleration windows” to decide which data should be indexed and how long it should be rapidly accessible. This poses a serious issue to customers interested in holding onto their logs for a long time, without incurring a significant cost.
Coralogix offers a full remote archive and query solution, which enables customers to hold onto their data for as long as they like, reindex it if they choose, or directly query their data without indexing, opening the door to profound cost optimization.
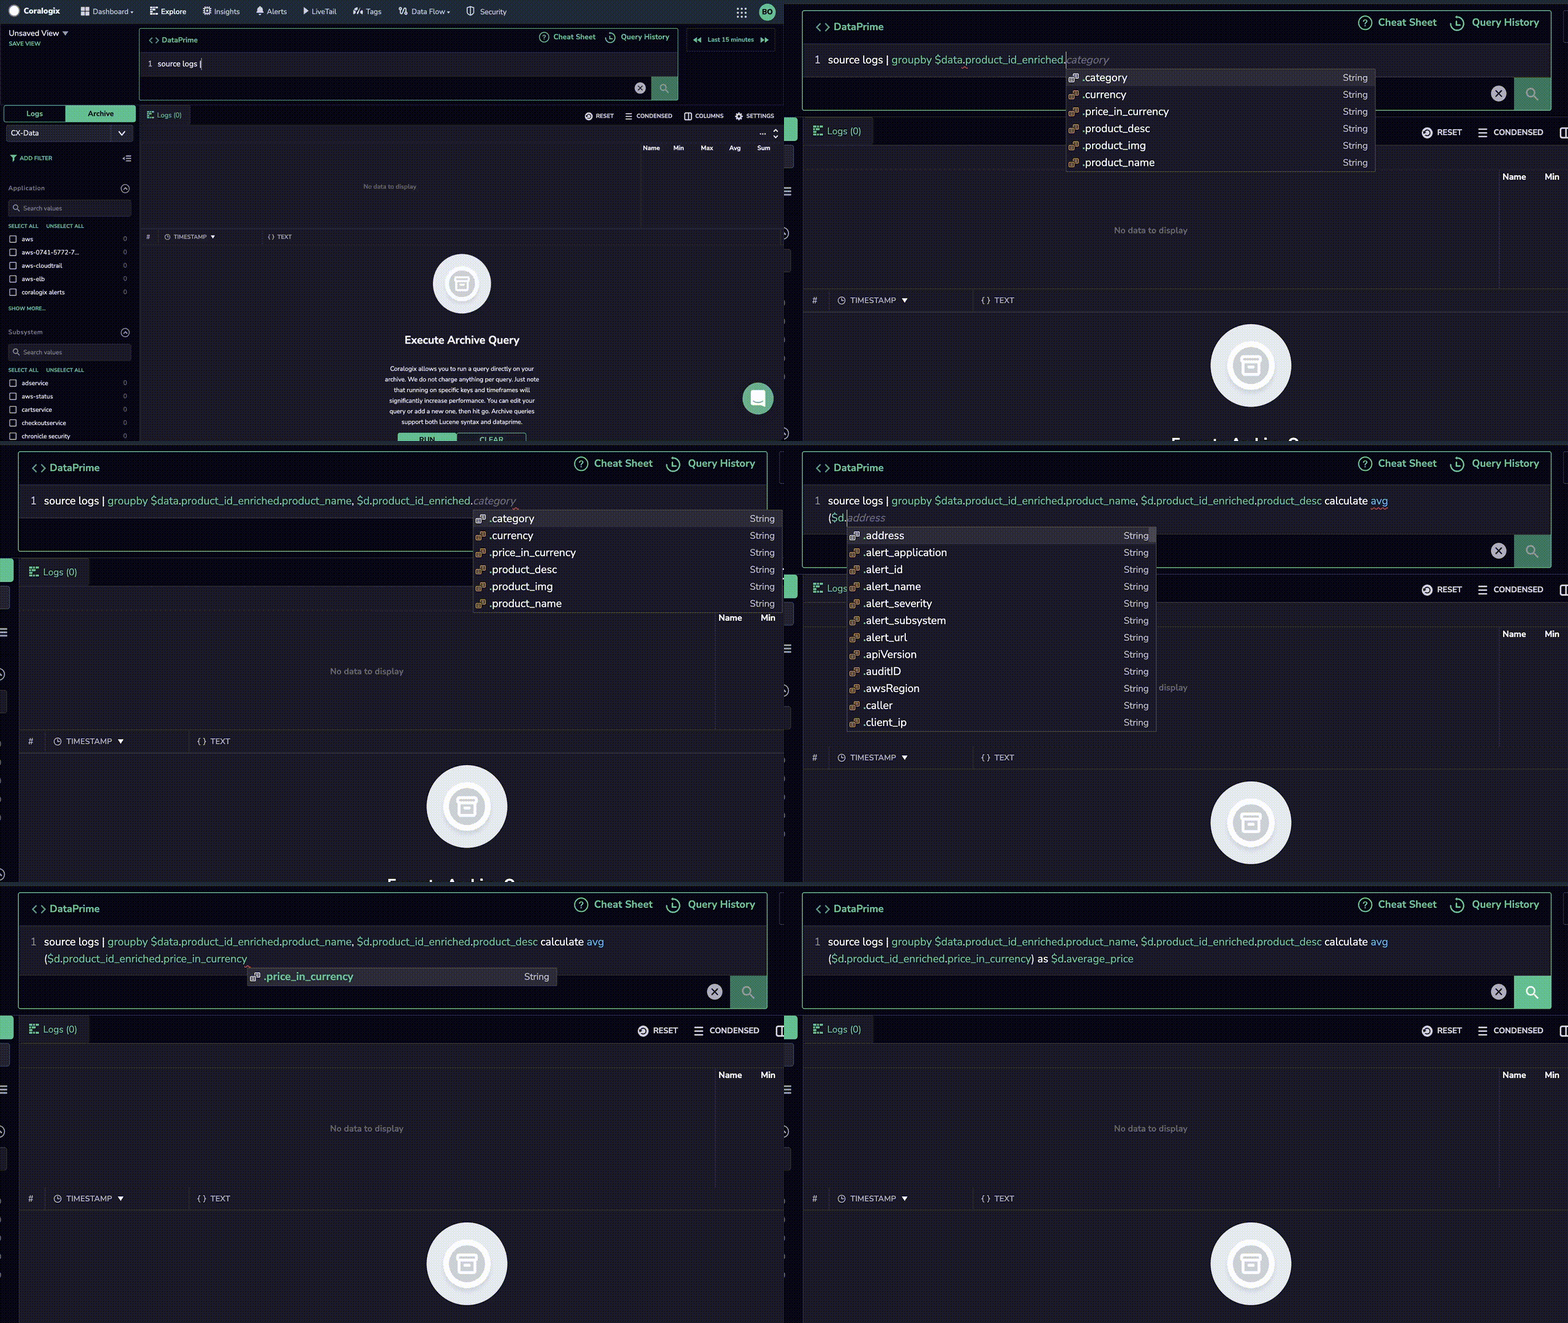
The Coralogix pricing model is based entirely on GB ingested into the data pipelines that meet your needs. There is no extra costs for features making it easy for you to predict costs. Here are the data pipelines or use cases available in Coralogix:
On the other hand, the Observe offering is based on usage. This has the potential side effect of encouraging Observe customers to use the platform as little as possible for fear of increasing spending. This constraint is dangerous in a significant troubleshooting scenario and can limit proactive insight generation.
With Coralogix, once data is ingested, it is yours to do as you please. There are no extra charges or hidden costs for specific features in the Coralogix platform. Everything is included within the ingestion cost.
Observe has not published anything explaining what their support model is or how it works.
Coralogix offers all customers a median 30-second response time, an SLA measured in minutes, and 24/7 support. Coralogix also offers a median resolution time of 43 minutes. This is faster than every other vendor in the market today.
Observe does not bring much in the way of prebuilt dashboards. It has a few solutions targeted towards specific technology, like containers, but it is mostly a task of building your own dashboards or creating your own explorations through datasets.
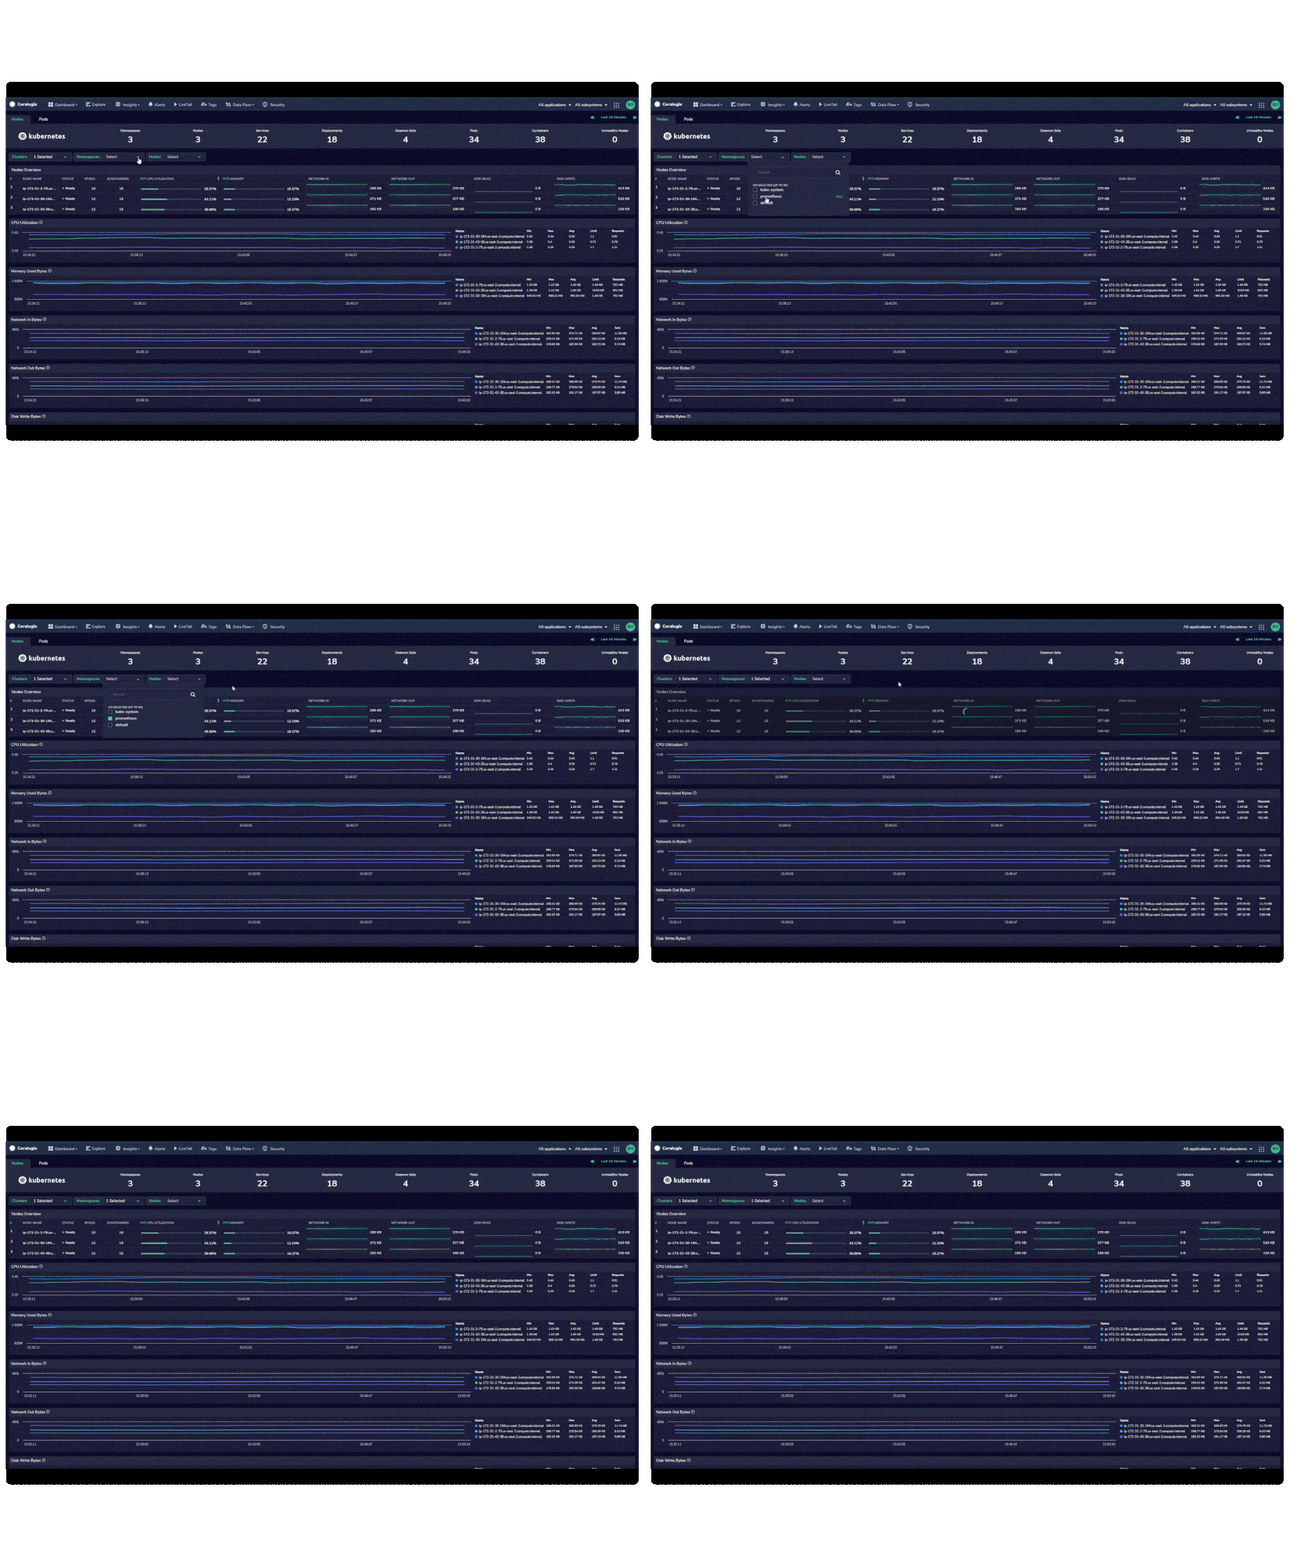
Coralogix has built dashboards for Kubernetes Monitoring, Serverless monitoring and more, while also supporting open-source dashboarding solutions like Grafana. Coralogix also provides a custom dashboarding solution for Coralogix users. The platform’s reuse of open-source dashboards, like JSON definitions for Grafana, and the time-to-value of premade dashboards make its offerings the best of both worlds, while charging nothing extra for their use.
Observe has some brilliant points. It’s great to see that they share our commitment to a vendor lock-in-free experience for their customers, but ultimately, their lack of features, limited pre-built dashboards, missing compliance certification, and lack of a long-term logging solution leaves them lagging behind Coralogix in almost all serious use cases.

SaaS Observability is a busy, competitive marketplace. Alas, it is also a very homogeneous industry. Vendors implement the features that have worked well for their competition,…
More platform teams owning multi-tenant systems need a full-stack observability solution that aggregates volumes of data into logs, metrics and traces. In tandem, there’s a growing…
Splunk has become one of several players in the observability industry, offering a set of features and a specific focus on legacy and security use cases….