3-Click Indexless Network Monitoring: AWS & Coralogix
Network infrastructure is the hidden glue between servers. In AWS, it takes skill, knowledge and experience to build a network that can be monitored, will perform…
Whether you are just starting your observability journey or already are an expert, our courses will help advance your knowledge and practical skills.
Expert insight, best practices and information on everything related to Observability issues, trends and solutions.
Explore our guides on a broad range of observability related topics.

AWS S3 access logs provide detailed records for requests made to S3 buckets. They’re useful for many applications. For example, access log information can be useful in security and access audits. It can also help generate customer insights and better understand your Amazon S3 bill.
Coralogix makes it easy to integrate with your S3 server access logs via a Lambda function.
You can learn how to parse S3 Server Access Logs using Coralogix rules here and in this blog.
This regular expression was used to parse the access logs in the creation of this document. Since flow logs can be customized you have to make sure that the regex correctly matches with your log fields.
S3 access logs’ structure is described in this AWS document. The logs can be customized by using query string parameters prefixed by ‘x-’. Remember that in case of a customized log, the rule’s regex needs to be customized as well.
The field ‘requester’ holds the canonical user ID of an S3 operation’s requester. When the request is unauthenticated the value will be ‘-’. Some companies will require only authenticated requests and would like to be alerted when an unauthenticated one was issued.
Alert Filter: ‘requester.keyword:/\-/
Alert Condition: ‘notify immediately’
Because ‘-’ is an Elasticsearch token delimiter, we’re using a regular expression in the query and the field.keyword that holds the first 70 characters in a field as one token. See more here
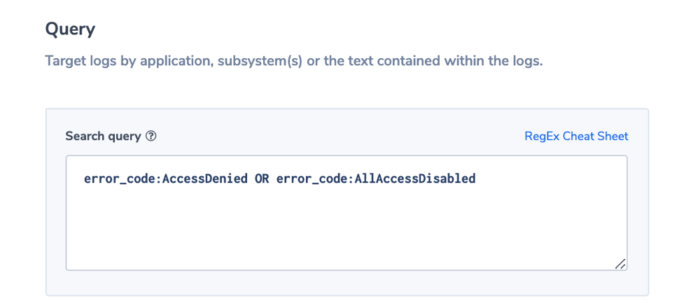
S3 operations return meaningful error codes and description, beyond the http numeric status codes. The key errorCode holds this value. In this example we are interested in accessing issues that might flag security problems.
Alert Filter: error_code:AccessDenied OR error_cose:AllAccessDisabled
Alert Condition: ‘notify immediately’
The field turnarround_time reflects the time it takes S3 itself to process the request from the time it gets to the server to the time it leaves.
Alert Filter: turnaround_around_time.numeric:[15 TO *]
indicating that we are looking for requests that took 15 ms or more.
The Alert Condition: is ‘more than usual’.
Using the power of machine learning to find deviations from the normal.
[15 TO *] is Elasticsearch syntax indicating that we are looking for requests that took 15 ms or more. We will indicate 15 ms as the threshold in the alert condition. We are using the .numeric field, for more information on .numeric and how Coralogix stores key values see here.
Most companies are sensitive to unauthorized users trying to access certain buckets. This alert will send a notification upon such an event.
Alert Filter: NOT requester:012345678901 AND bucket:mys3bucket
Alert Condition: ‘notify immediately’
We use the combination of bucket name and requester as each bucket might have a different authorization configuration. Important to note that the requester can be in the form of an IAM or a unique ID.
In the example we assumed an IAM. The account number is a token in the IAM string. You can read more about IAM and unique ID’s here.
In this example, we have a bucket that is authorized for an application module using an IAM but is read-only for any other user. To keep the integrity of the data, operations would like to be notified if an unauthorized write is identified. It may be the result of a bug or a malicious operation.
Alert Filter: operation:REST.PUT.OBJECT AND NOT requester:012345678901
Alert Condition: ‘notify immediately’.
Note: The operation field can come in different formats, see here. We used the REST format for this example.
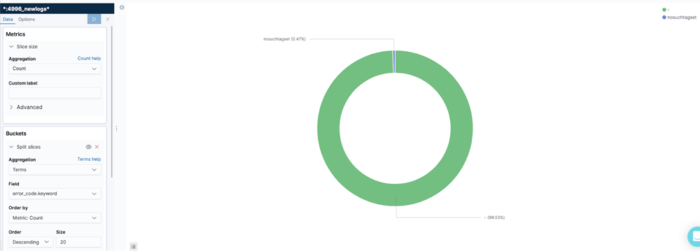
This visualization shows the different errors as part of the number of S3 operations. It allows users to keep an eye the % of non-faulty operations and take action if it drops below a threshold.
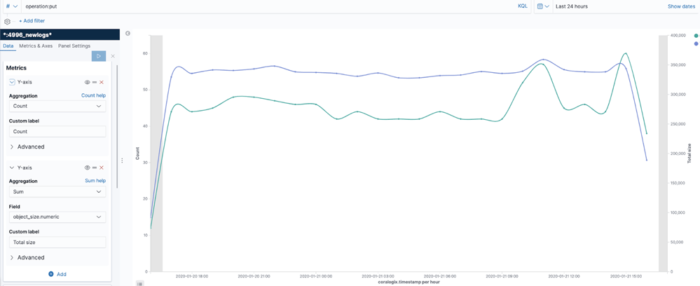
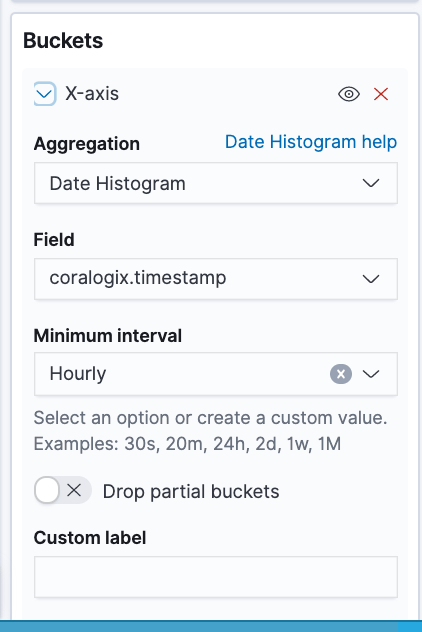
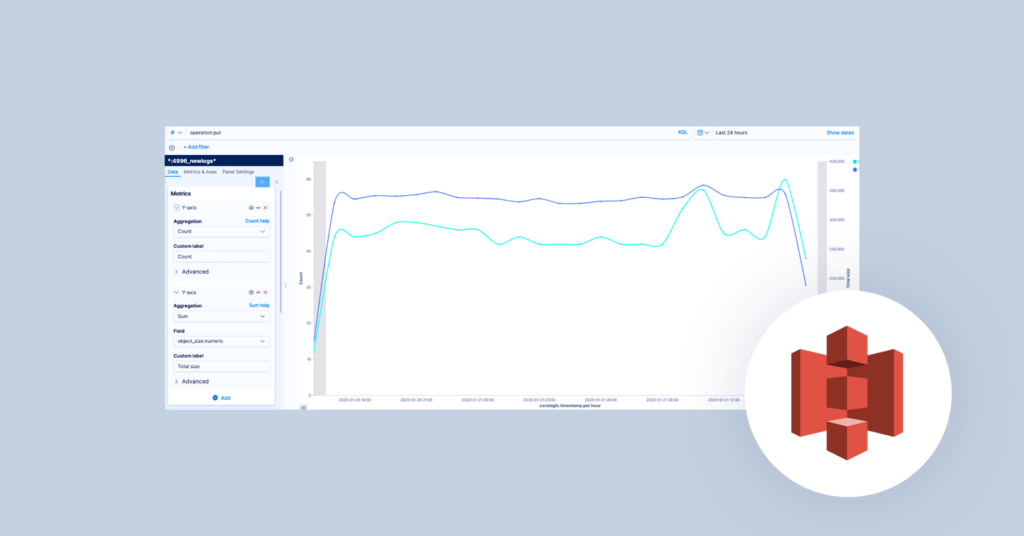
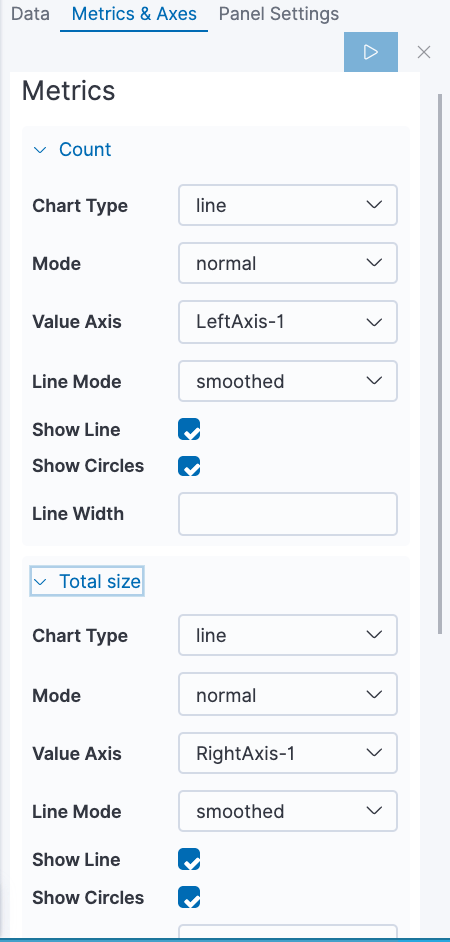
This visualization sums the number of write operations and bytes written per hour.
This table shows the 3 most active users in a bucket
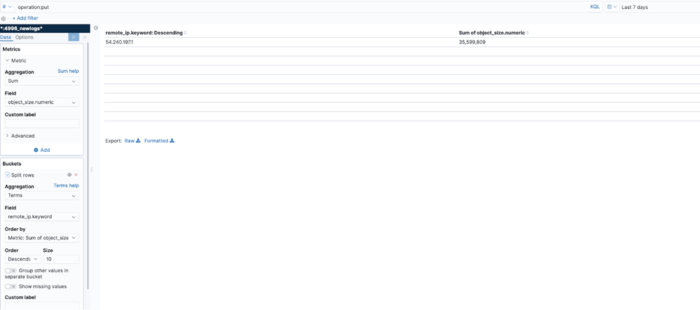
This visualization shows the top IP addresses by number of operations.
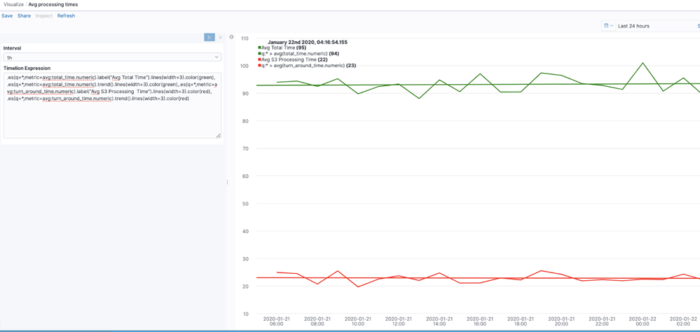
This visualization uses Timelion to give the avg total time, which is the number of milliseconds the request was in flight from the server’s perspective, and the turnaround time, which is the number of milliseconds that Amazon S3 spent processing the request. The trend() function is chained to show a trend line for each time series.
In this blog post you got some useful pointers explaining what S3 logs are and their structure. The post focused on providing examples of alerts and visualizations that can help you unlock the value of these logs. Remember that every user is unique and has its own use case and data. Your logs might be customized and configured differently and you will most likely have your own requirements. So, you are encouraged to take the methods and concepts showed here and adapt them to your own needs. If you need help or have any questions, don’t hesitate and reach out to [email protected]. You can learn more about unlocking the value embedded in AWS and other logs in some of our other blog posts.
Network infrastructure is the hidden glue between servers. In AWS, it takes skill, knowledge and experience to build a network that can be monitored, will perform…

AWS Elemental MediaTailor provides a wealth of information via metrics, but one key feature that is very difficult to track is the Transcoding performance. What is…

In today’s interconnected digital landscape, robust IAM (Identity and Access Management) practices are critical pillars of an organization’s cybersecurity strategy. IAM serves as the fortress guarding…


