11 Tips for Avoiding Cloud Vendor Lock-In
Cloud vendor lock-in. In cloud computing, software or computing infrastructure is commonly outsourced to cloud vendors. When the cost and effort of switching to a new…
Whether you are just starting your observability journey or already are an expert, our courses will help advance your knowledge and practical skills.
Expert insight, best practices and information on everything related to Observability issues, trends and solutions.
Explore our guides on a broad range of observability related topics.


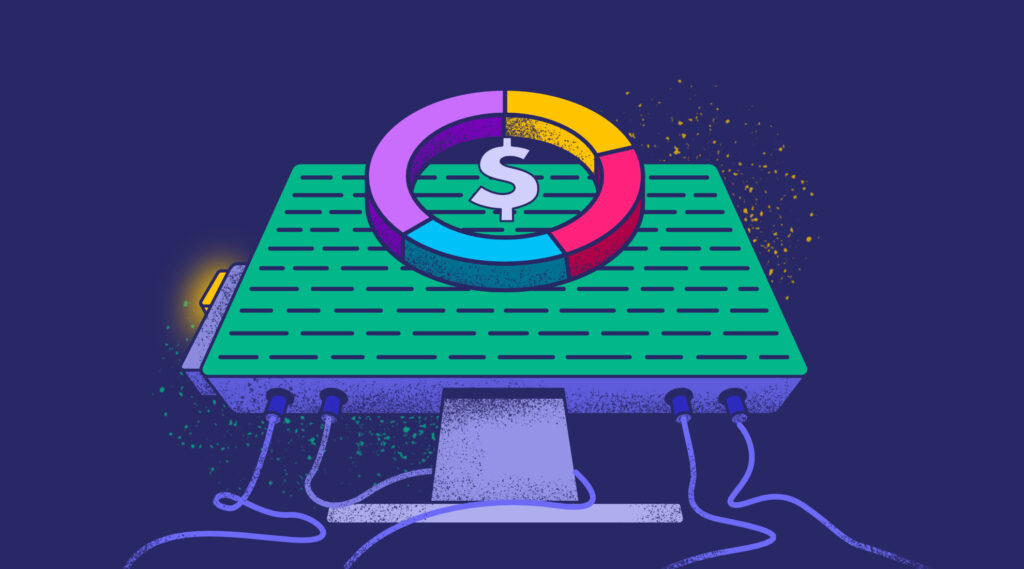
Although microservices and cloud architectures are the new norm for modern applications, cloud cost optimization could run high in observability.
High costs are largely due to the number of components involved in cloud architectures. According to Cloud Data Insights in a recent report, around 71% of IT companies say that cloud observability logs are growing at an alarming rate— a driving factor for rising observability costs.
This article will explain how to manage cloud cost optimization while ensuring your applications are monitored around-the-clock. We’ll also review the best cost-efficient full-stack observability platforms to help maximize your savings.
Cloud cost observability mainly depends on four key factors — the volume of data generated, how you manage that data, the number of microservices your application has, and your observability tool. Here’s how each of these factors affects your observability costs:
IT and SaaS companies often find it hard to foresee the number of requests their application may receive. Initially, during the building stages of a product, your needs would be measurable and easy to predict.
Then, once your product gains traction, it could be difficult to estimate the number of users consistently. More users mean more requests that translate to more logs and higher costs. There’s no real way to predict observability costs, making it considerably hard for you to define a budget.
Microservice architectures directly help in scaling your applications by enabling faster deployments. However, these architectures also require quite a few microservices. As the number of microservices increases, so do the requests each one gets.
Further, cloud infrastructures tend to be complex, with separate containers supporting both your production and pre-production services. Such a complex infrastructure also requires monitoring.
DevOps is a relatively new domain. Traditionally, developers have been responsible for integrating observability tools with their applications, and many smaller organizations still choose to follow this convention.
That being said, it’s important to note that developers are skilled at their core job, i.e. building an application. Sure, some developers might be cross-functional and know a thing or two about observability, but not as much as your DevOps team.
Allowing developers to patchwork your observability set-up can lead to higher costs, since they often don’t know what needs to be observed. Therefore, having a DevOps team is crucial, even if it means making multiple changes to your organizational structure to accommodate it.
Most cloud observability tools have complex pricing models. Ideally, you’re charged based on the amount of data the tool ingests, but there could also be additional charges.
For example, some tools charge you based on what features you want and how many agents of the tool you would want to deploy. Companies looking to optimize business cost performance with observability could end up paying more for the application enabling it if they are not careful.
More than two-thirds of the employees participating in a 2023 survey have confirmed a six-figure annual budget – just for their observability tools. A smart cloud observability strategy can optimize this budget. Here are 4 ways you can keep observability costs down:
If your application is hosted on a cloud cluster, you don’t need to export its logs to your observability tool. You can access, analyze, and glean insights on the cluster level when it comes to nodes and pods.
Cloud platforms also enable logs, which you can view on the dashboard. The logic here is simple —- the lesser the amount of data ingested by your observability tool, the lesser the cost.
It can be a struggle to decide between keeping all your log data for observability and throwing away log data that adds no business value. Let’s say your application has a bot that frequently keeps connecting to a server over SSH.
Do you need a log generated every five minutes notifying you of the connection? Would it help you analyze why something in your production broke down? Mostly not. Instead, you can utilize the filter option to remove unnecessary logs from the get-go, thereby saving both storage and costs.
According to the same report by Cloud Data Insights, more than 13% of IT organizations use over thirteen observability tools. Many observability tools are often great at one aspect of monitoring, say database/application anomalies, infrastructure monitoring and metadata monitoring.
The right observability tool should address your organization’s specific needs. For instance, if your application is characterized by heavy database usage, you would want to make the most of the database monitoring feature.
If you already have a testing team at work to figure out the anomalies in your database, then just add basic monitoring to the mix. In this case, look for an observability tool specializing in other aspects, such as infrastructure monitoring.
Customers, requests, and usage change and update every day. Data that is six months stale would hardly help you optimize your application’s performance.
Shifting stale log data to cold storage is a wise option to decrease observability costs. If you need to go back six months to analyze the root cause of a recurring bug, you can easily fetch the data from the cold storage.
Coralogix provides unlimited full-stack observability for modern applications. We have a highly efficient pricing model, with rates starting from $0.17, $0.05, and $0.075 per GB for logs, metrics, and traces. With Coralogix, you get advanced dynamic alerting to help you tackle potential application downtime before it affects customers. You’ll also get access to thorough vulnerability assessments at extremely competitive rates and no hidden charges.
DataDog is an observability platform focusing on limitless logging. Datadog costs around about $0.10 for logs and metrics, but there’s a catch — querying archived data in DataDog incurs costs. While it may look like you’re saving on data generation costs, you’re just delaying the long-term storage expenses. When it comes to Coralogix vs. DataDog, Coralogix is a better option if you have a long-term vision for your application.
Another popular observability platform, New Relic provides end-to-end visibility of your entire application. One of its attractive characteristics is that you can specifically check where the resources are being used in your application. New Relic charges $0.30 per GB for logs, metrics and traces.
You can read our in-depth review on Coralogix vs New Relic to figure out which is right for your organization.
Observability doesn’t have to be expensive. You can significantly reduce the expenses of your observability tools by just being mindful of the data you’re asking it to ingest. Your entire team needs to understand why the tool is being used and how it processes data.
It’s vital to choose the right observability tool that makes this process simple for your organization. Our full-stack observability guide walks you through how to make the most of these observability tools.

Cloud vendor lock-in. In cloud computing, software or computing infrastructure is commonly outsourced to cloud vendors. When the cost and effort of switching to a new…

More platform teams owning multi-tenant systems need a full-stack observability solution that aggregates volumes of data into logs, metrics and traces. In tandem, there’s a growing…

With various open source platforms on the market, engineers have to make smart and cost-effective choices for their teams in order to scale. Elastic Cloud, and…