Is your CDN really at the edge?
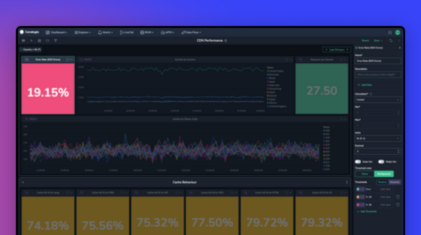
tldr: This post discusses how to measure CDN request locality without indexing a single log. The function of a CDN is to bring cacheable data, like…
Whether you are just starting your observability journey or already are an expert, our courses will help advance your knowledge and practical skills.
Expert insight, best practices and information on everything related to Observability issues, trends and solutions.
Explore our guides on a broad range of observability related topics.

As Elasticsearch is gradually becoming the standard for textual data indexing (specifically log data) more companies struggle to scale their ELK stack. We decided to pick up the glove and create a series of posts to help you tackle the most common Elasticsearch performance and functional issues.
This post will help you in understanding and solving one of the most frustrating Elasticsearch issues – Mapping exceptions.
Mapping in Elasticsearch is the process of defining how a document, and the fields it contains, are stored and indexed, each field with its own data type. Field data types can be, for example, simple types like text (string), long, boolean, or object/nested keys (which support the hierarchical nature of JSON).
Field mapping, by default, is set dynamically, meaning that when a previously unseen field is found in a document, Elasticsearch will add the new field to the type mapping and set its type according to its value.
For example, if this is our document: {“name”: “John”, “age”: 40, “is_married”: true}, the name field will be of type string, the age field will be of type long, and the is_married field will be of type boolean.
When the next log, containing any of these fields, will arrive, our Elasticsearch Index will expect the log fields to be populated with values of the same types as the ones that were determined previously in the initial mapping of our Index.
But what if it didn’t?
Basically, the mapping determination is a race condition, the first key type to arrive at an index determines that key name type until the next index is created. Let’s take this log for example, {“name” : {“first“ : “John”, “second“ : “Smith”}, “age” : 40, “is_married” : 1}. The field “name” is actually a JSON object and the field “is_married” is now a number, this will result in the log causing two different mapping exceptions.
The log, in this case, will be discarded without being Indexed in Elasticsearch at all. We can consider this as data-loss, without having any indication of that incident besides the Elasticsearch log files, which will contain a mapping exception for each log (also impacting the cluster performance).
These scenarios happen more frequently when different programmers are working on the same projects, printing logs with the same fields’ names, only they are using a different set of values. How do we handle these mapping exceptions when we encounter them?
For starters, what you do not want to do is to manually change the type of the exceptions field (in our case ‘name‘) to object, existing field mappings cannot be updated. Changing the mapping would mean invalidating already indexed documents.
Instead, you should create a new index and then separate the ‘name‘ key to separate fields for strings and objects. E.g, assign objects to ‘name_object‘, and strings to ‘name‘. Thus, the mapping of the new index will have the two keys ‘name‘ and ‘name_object‘ which populate strings and objects respectively.
Coralogix handles numeric Vs string mapping exceptions by dynamically adding a .numeric field to keys containing numbers that were previously mapped as a string.
In case Coralogix encounters a mapping exception it can’t handle (e.g Object Vs String, number Vs boolean, etc.), it stringifies the JSON and puts it under a newly generated key named ‘text‘. In either case, you won’t lose your data as a result of an exception.
In addition to that, Coralogix’s ingest engines add a ‘coralogix.failed_reason‘ key to any log that triggered a mapping exception so that our users can search, create alerts, or build visualizations to spot mapping exceptions and their root cause.
Each Coralogix client gets a predefined mapping exceptions dashboard that presents the number of logs that triggered mapping exceptions grouped by ‘coralogix.failed_reason‘ field, which describes the exception reason (find it under Kibana > dashboards > Mapping Exceptions Dashboard). Here are some examples of mapping exceptions message:
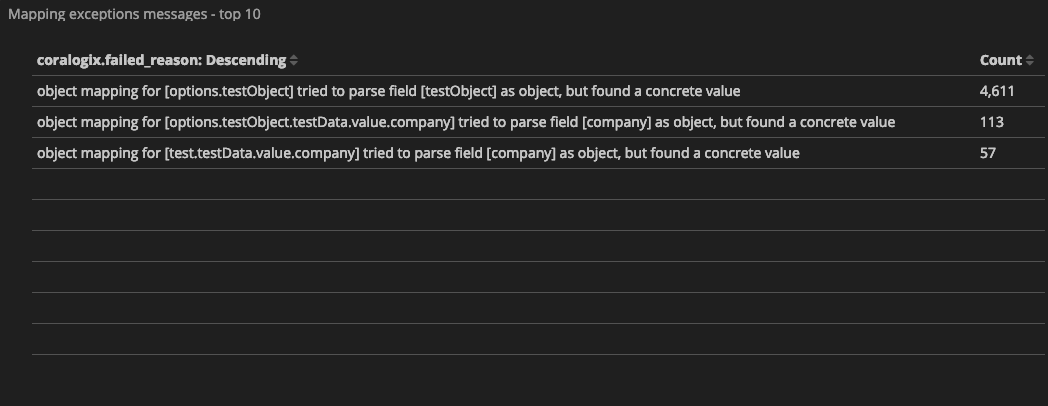
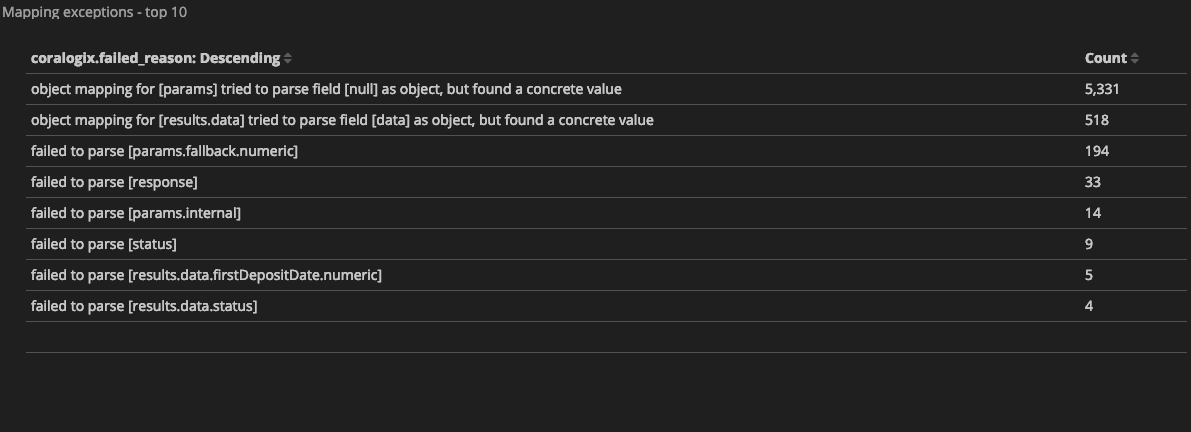
These are the actual messages ‘coralogix.failed_reason‘ key holds when a log input causes a mapping exception, and they tell us the story of what went wrong and of course, help us fix it.
Let’s investigate the following exception message: “object mapping for [results.data] tried to parse field [data] as object, but found a concrete value”.
From this message we can infer that ‘data’, which is a nested key within ‘results’, was initially mapped as an object and later arrived, numerous times, with a value of type string.
How can we fix the issue so the next log that will arrive with a string as the value for ‘data‘ won’t trigger an exception?
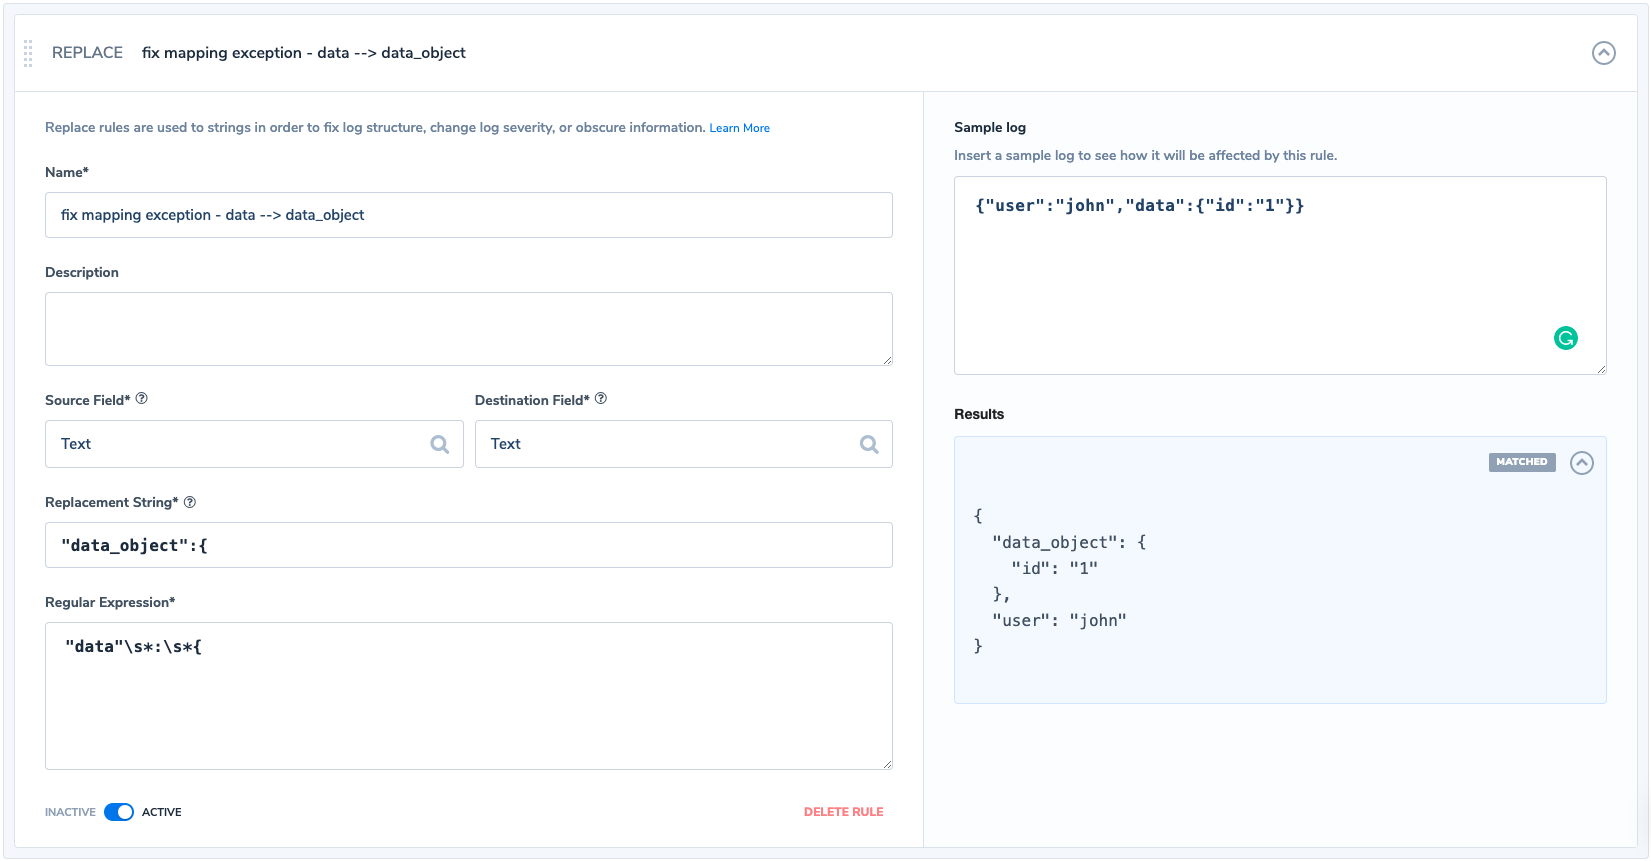
Coralogix offers a parsing rule engine. Among other useful parsing options, you can find the ‘Replace’ rule that enables the user to replace a given text, using REGEX, with a different one before the log is getting mapped and indexed in Elasticsearch.
What we would like to do is to use Regex and match any log entry that contains the ‘results.data‘ field as an object (starts with an opening curly bracket) and replaces ‘data’ with’data_object’. Any similar occurrence from this point will assign the object to the new key ‘results.data_object‘.
This new key was created and added to the mapping of our index on the arrival of the first entry that matched after applying our rule. This is how our rule would look like in Coralogix:
If we are not sure of which rule to configure we can use the Coralogix ‘Logs’ screen to run some queries and see the valid logs and the logs which encountered a mapping exception.
In Coralogix:
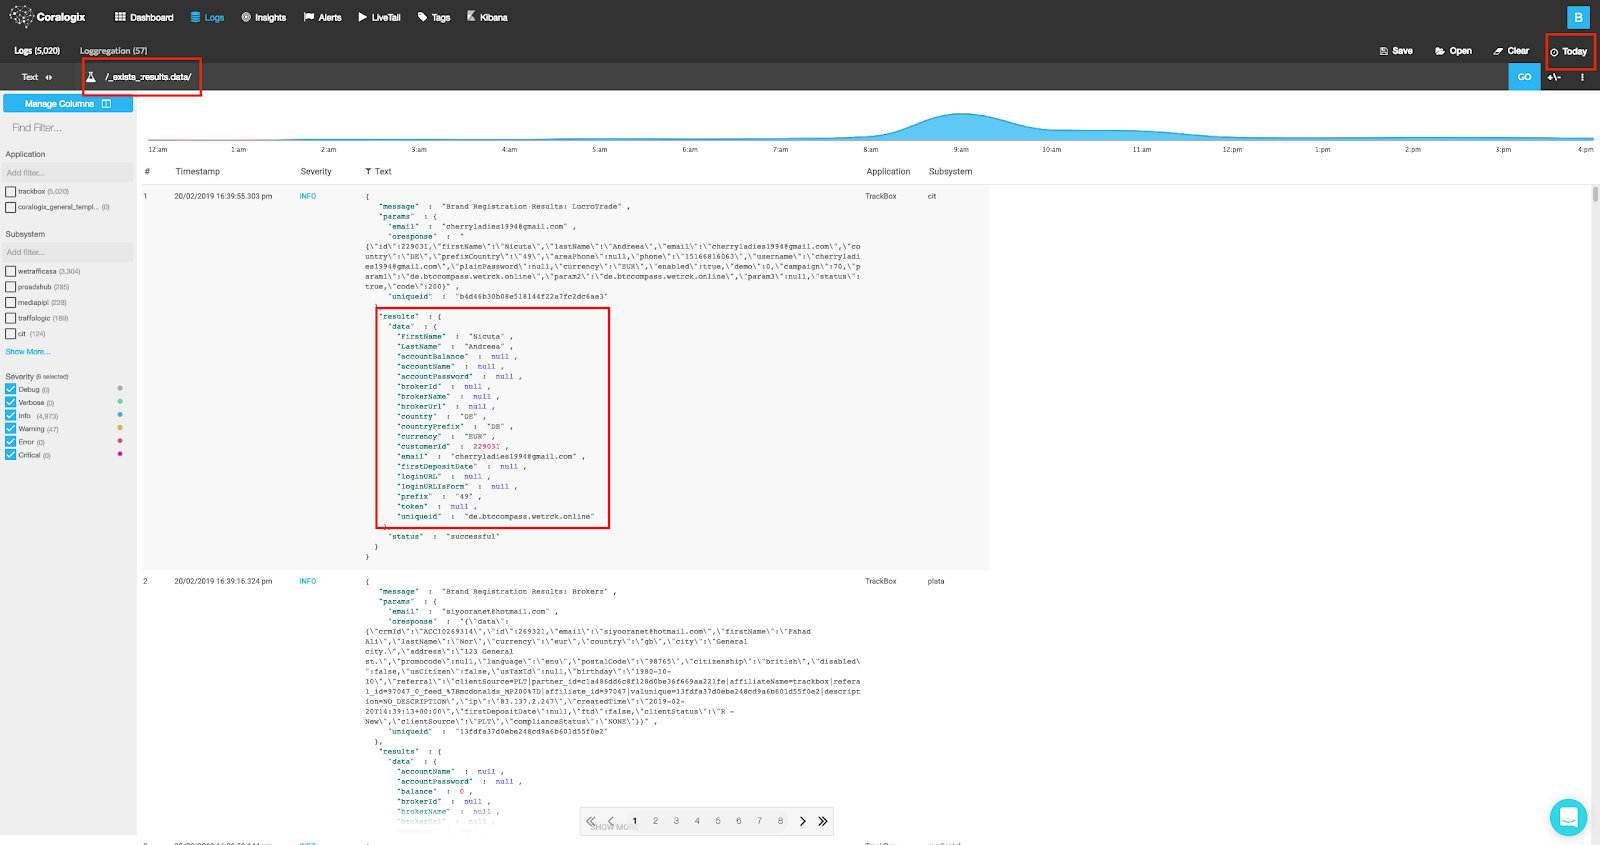
Run the following query: _exists_:results.data, and you should retrieve logs with existing (meaning correctly mapped) results.data field, we can easily notice that all of these valid logs present a JSON object within results.data.
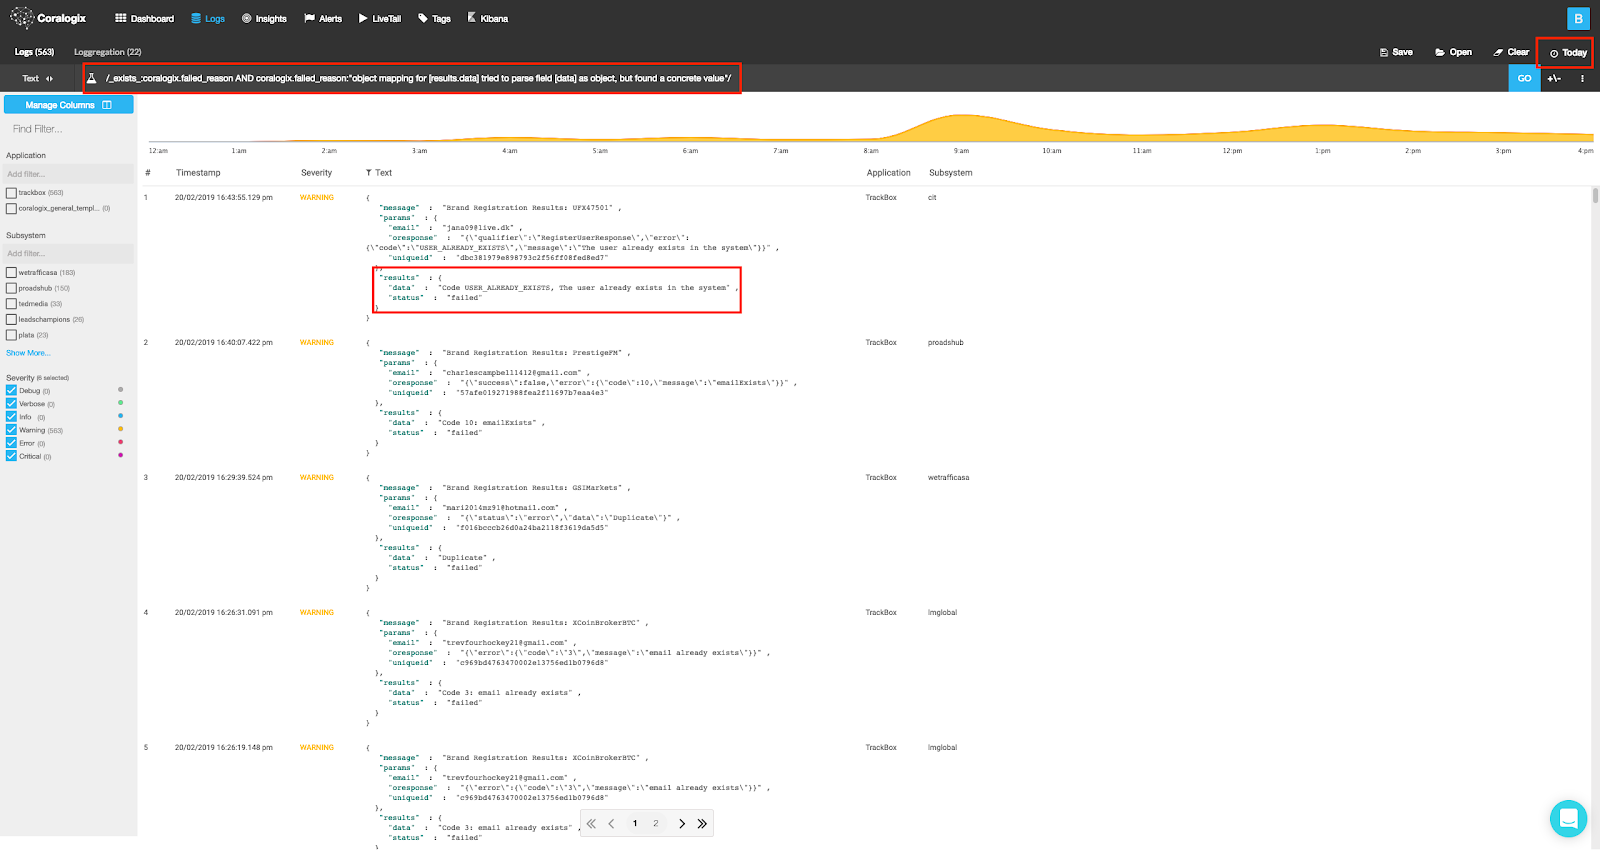
The query: _exists_:coralogix.failed_reason AND coralogix.failed_reason:”object mapping for [results.data] tried to parse field [data] as object, but found a concrete value”, will show us logs that encountered the specific mapping clash found in our Coralogix Mapping Exceptions Dashboard, confirming our analysis.
In Kibana:
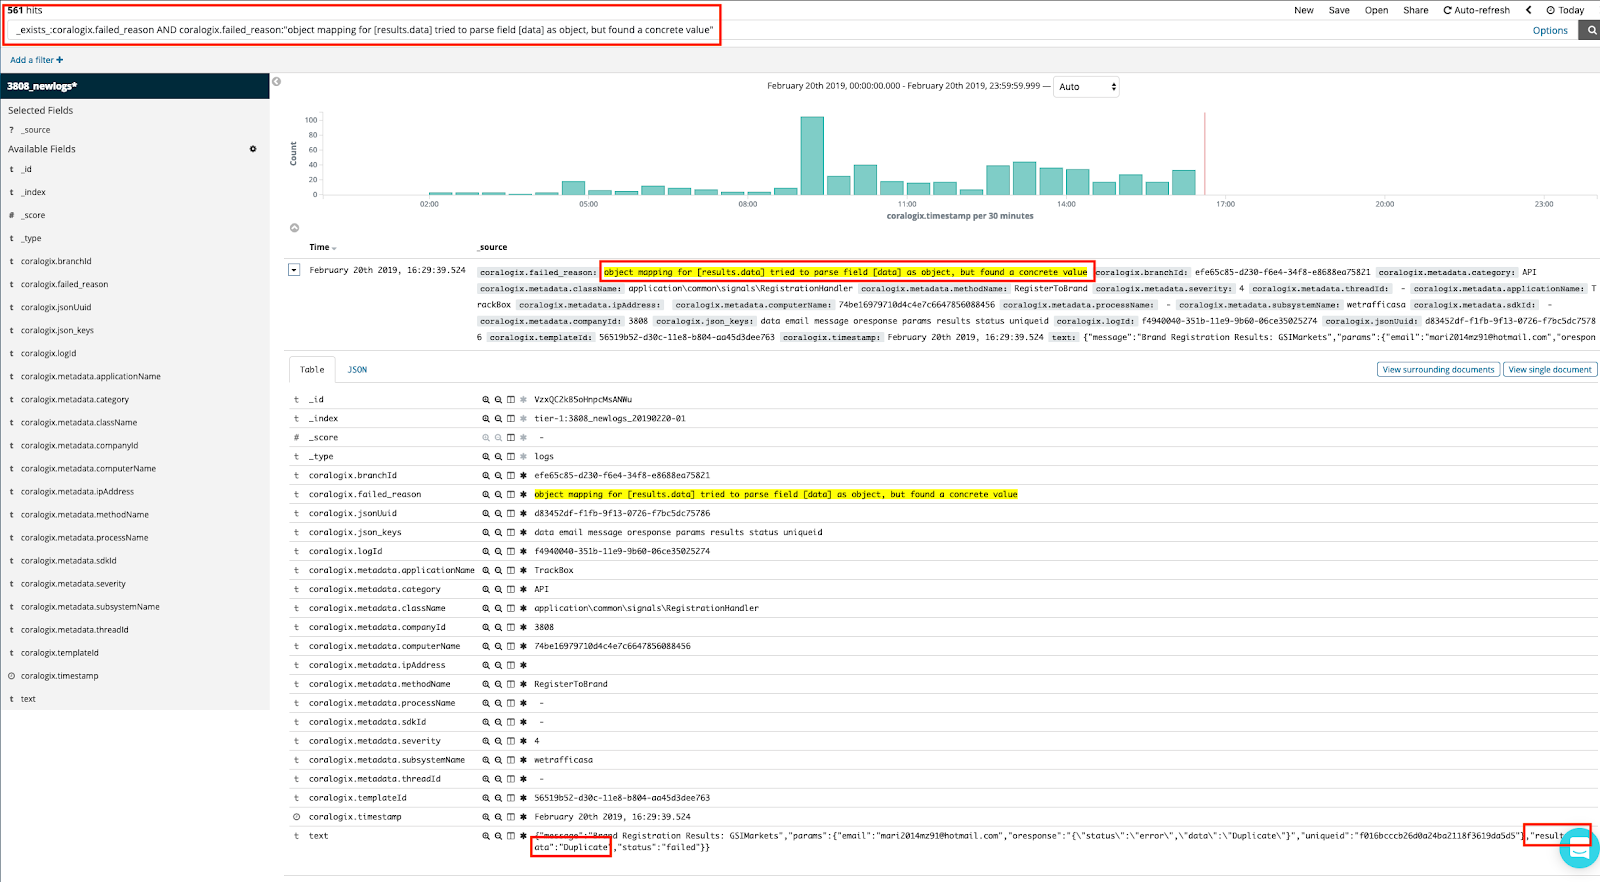
Running the same query in Kibana will retrieve logs that failed to be mapped by Elasticsearch. We can see that the entire JSON payload of the log was stringified and stored into column text, verifying the fix action we should take.
Let’s take another example of an exception message: “failed to parse [response]”. We’ll encounter such exception in either of the following cases:
“response” field is of type string and the logs that triggered the exception include a JSON object in it.
Our replace rule:
“response” field is of type boolean and the logs that triggered the exception included a numeric value (0/1) or “false”/”true” in double-quotes (represents a string type in Elasticsearch), instead of the terms false/true which represent a Boolean type.
This case will require 2 rules for fixing each mapping exception type:
Our #1 replace rule:
Our #2 replace rule:
Mapping exceptions are reported in the field ‘coralogix.failed_reason’. An alert aggregation on this field will provide us the desired result. Since the mapping exception data is added at indexing time, the regular Coralogix Alerts mechanism would not have access to this information, therefore it could not be used to configure this type of alert. However, we could use Grafana alerts to achieve this goal.
I will show you how to configure your own Grafana Mapping Exceptions Dashboard, so you could use a Grafana alert for this. This tutorial assumes that Grafana has already been installed, and Coralogix defined as a Data Source in Grafana. For instructions on configuring the Grafana plugin, please refer to: https://coralogix.com/tutorials/grafana-plugin/
In order to install the Dashboard, please follow these steps:
1. Download and decompress the Grafana Dashboard file: “Grafana – Mapping Exceptions Alerts Dashboard.json.zip“.
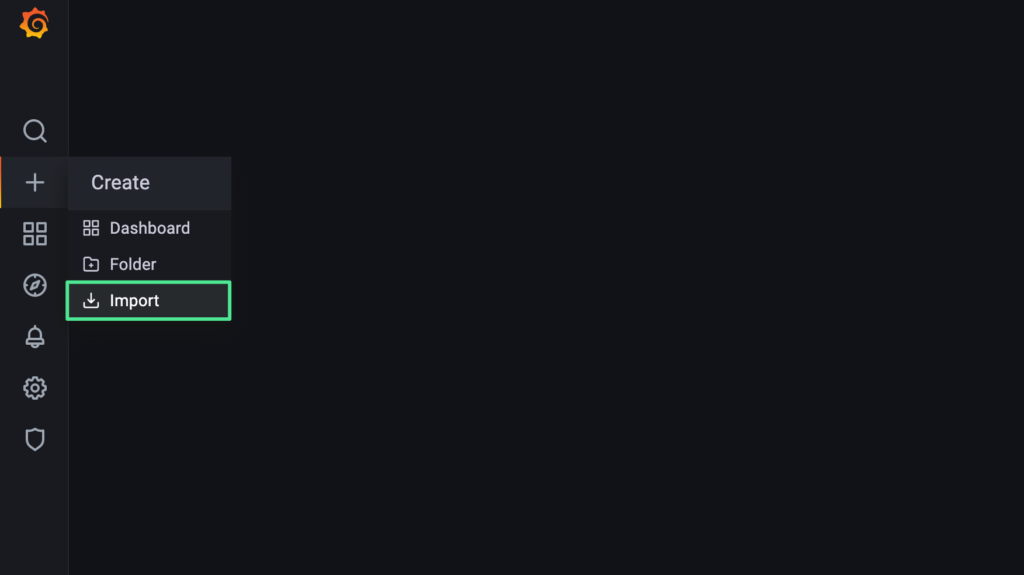
2. Go to Grafana and click the plus sign (+) / Create / Import.
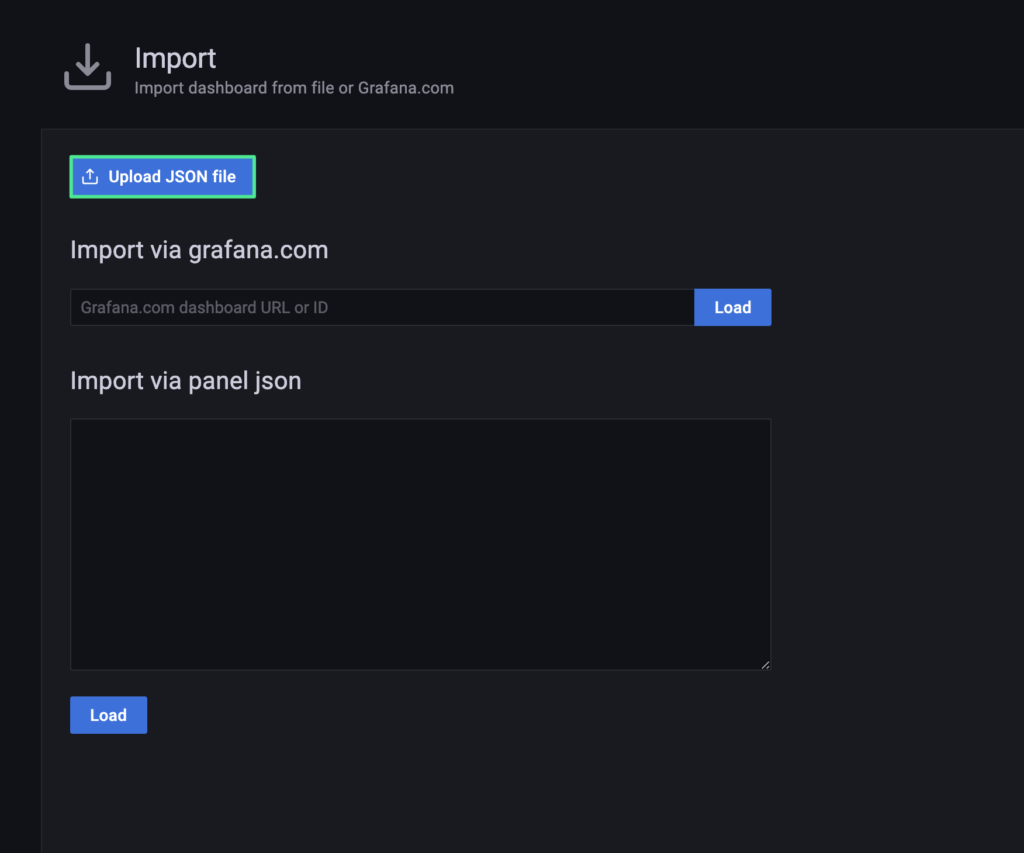
3. Click “Upload JSON file” and select the “Grafana – Mapping Exceptions Alerts Dashboard.json”, followed by “Open”.
4. Please make sure the correct Data Source has been selected, then click “Import” (“Elasticsearch” in this example).
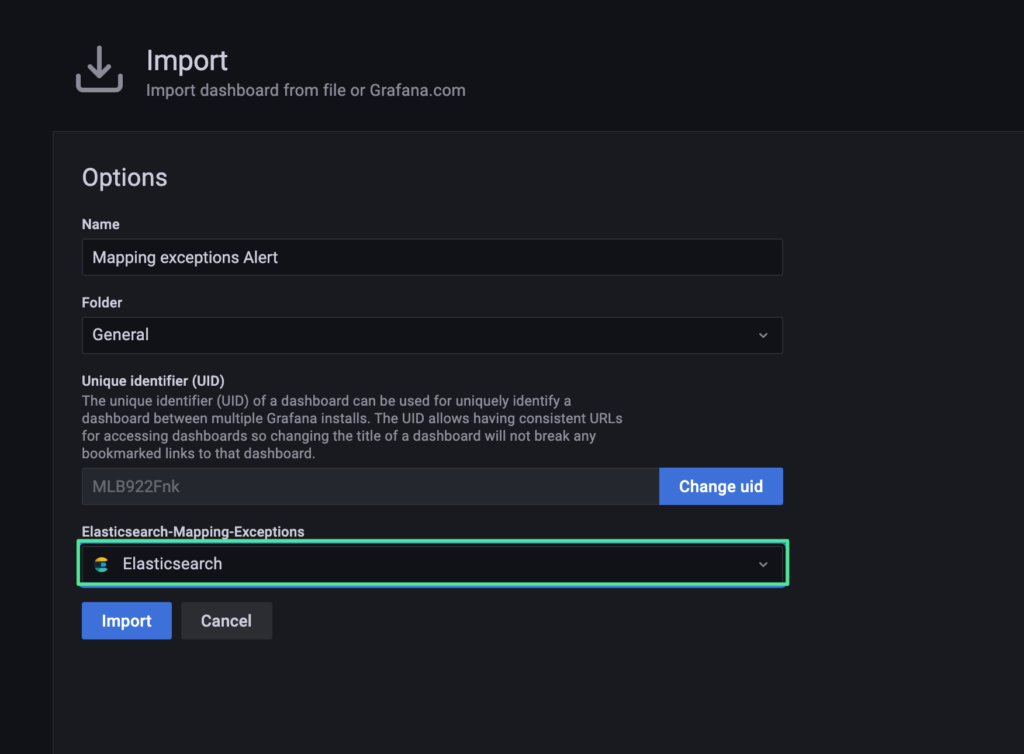
5. Please click “Save dashboard” on the top-right of the Grafana UI.

6. Enter an optional note describing your changes, followed by “Save”.
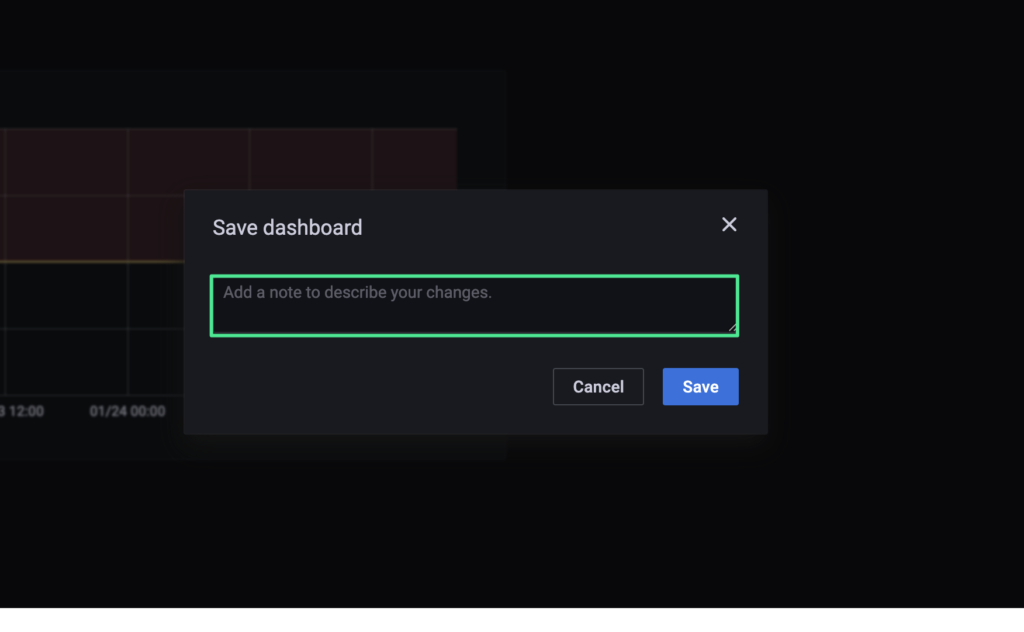
7. At this point, the Grafana Dashboard will be saved, and the alerting mechanism activated.
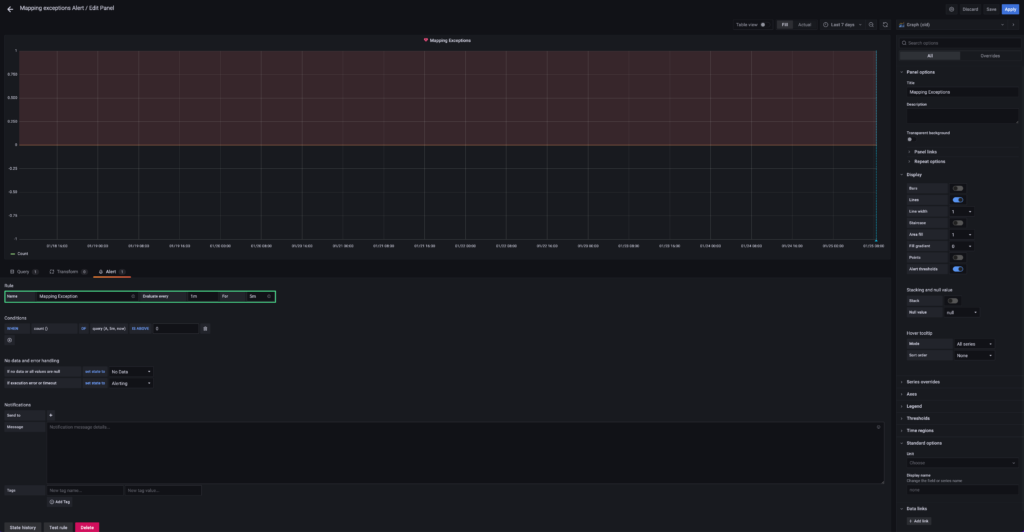
8. In order to review the alert settings, please click the bell icon on the left-side of the Grafana UI, followed by “Alerting” / “Alert rules”.

9. Click “Edit alert”.

10. Review the alert settings.
11. Click “Query” on the left, to Review the query settings.
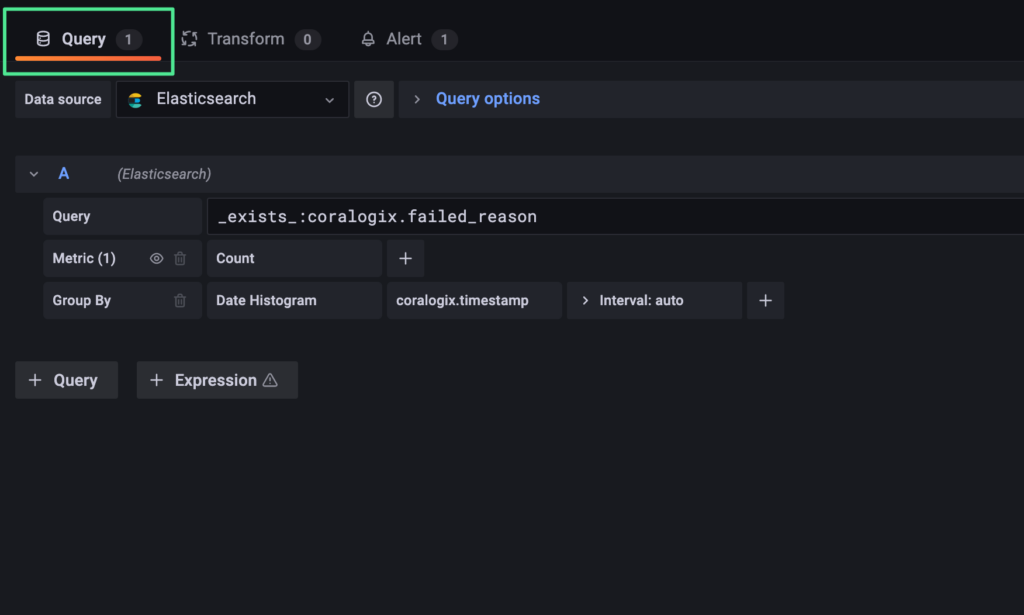
That’s it! 🙂

At this point, the Admin must determine how to receive alert notifications when a Mapping Exception occurs. For this information, please refer to the Grafana alert notifications documentation. We sincerely hope that you found this document useful. Enjoy your Dashboard! 😎
We should definitely take Mapping exceptions into consideration as they can cause data losses and dramatically reduce the power of Kibana and the Elasticsearch APIs. It is recommended to develop best practices across different engineering teams and team members so that logs are written correctly and consistently, or at the very least, choose the right logging solution that will give you tools to handle such issues and get your data on the right path.
tldr: This post discusses how to measure CDN request locality without indexing a single log. The function of a CDN is to bring cacheable data, like…

AWS Elemental MediaTailor provides a wealth of information via metrics, but one key feature that is very difficult to track is the Transcoding performance. What is…

Metrics are key to monitoring system health and performance but you probably are ingesting far more metrics than you will ever need or use. The issue…
